返回列表 发帖
05/21/2011

Many people ask me which color my preferred count is.  Now I start labeling that again but with an easier way.  The purple line is my preferred count.  The wave in gray is the alternative count.  Since things change all the time, current view does not reflect the actual view in the week to come.

Comments are welcome!


thanks for sharing. but why wave 2 is lower than wave 1
axp 发表于 2011-5-21 16:22


Good question!
That situation is called Running Flat pattern, which occurs in some strongly trending movements.  In a strong trending bull market, we could see many upward Running Flat corrections (because the demand is so strong that the market does not let the wave-2.c to go below wave-2.a).  In a strong trending bear market, it will be the other way around - many downward Running Flat corrections, which is why the wave-2.b goes below wave-1.
Hope this help.
05/28/2011

Comments are welcome!


06/04/2011

Comments are welcome!


1

评分人数

The following is my conversation with someone from another forum:

Thank for gold count.
Do you have Silver too ???


You are welcome. I don't trade silver. The following is what I see from silver's chart:

1. The low of 05/12/2011 is 50% retracement of a 5-wave bull run since 2010-Feb. Therefore a bounce occured from there.
2. The high of 05/26/2011 (or 05/31/2011) is the 38.2% correction of the fall from 2011-Apr.

Conclusion:
Right now, it's in a consolidation. It's hard to tell where it is heading to.
1. If the high of 05/31/2011 is penetrated, it could see 50% correction next ($41 area)
2. If the low of 05/12/2011 is penetrated, it could see 61.8% retracement. I hate to say that it's around $28 and previous wave-4 (of the bull run since 2010-Feb)

Given that I bet the gold to have a big 2-week fall, you know what I mean if I have to trade silver (but I don't trade silver). Good luck!
1

评分人数

She posted a chart and asked me again:

This is my silver count, can you please comment your idea? I'm bullish. I believe silver will reach $40 before open new lower.
...


1

评分人数

My answer to her post:


You are welcome to post your charts/counts in this thread, and that is what I want because I want to know how people see the market. Your chart looks very good. Before I make any comment, let's take a look the intraday waves of silver.

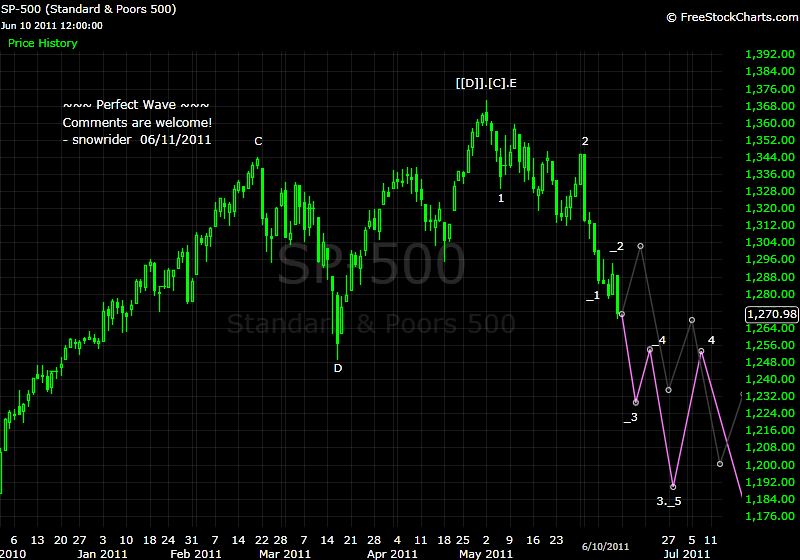
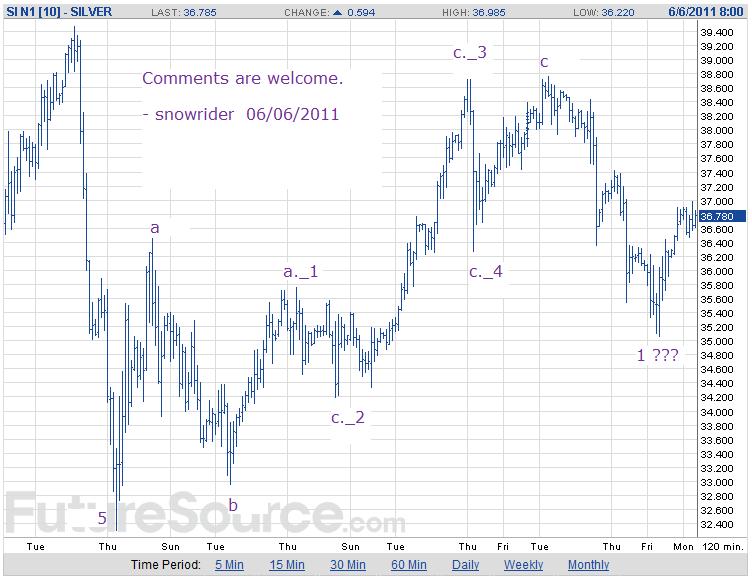
From the daily chart, it's hard for us to know if the wave from 05/12/2011 low to last week's high is an impulsive wave of a corrective wave. After seeing the intraday pattern, it seems to be a corrective wave (with 3 segments: a, b, c). The wave c is a classic one with 5 segments (_1, _2, _3, _4, _5) with one complex (_2) and one simple (_1) corrections inside. After the 3 segments, we see a impulsive mini 5 segments down. Is that the C.1, or is that still in the B (i.e., B.b)? We need the market to confirm.

1

评分人数

She did not seem to understand what I said, so she asked again to clarify:

snowrider, my english is not good, sorry.
In your chart above, you mean we have a FLAT 3-3-5? And that FLAT is wave B of higher ZIGZAG?
...


You are welcome.  From my chart, we see there is an a-b-c up and then a 5 mini segements down.  I mark "1 ???" for that down wave.  It could be:

1. A new big down wave has started, so the 5 mini segements down are actually the down wave 1 of bigger wave C.  (See your chart has big A-B-C down waves.) Then a big collapse is on the way.

2. The 5 mini segements down could be still in a complex correction of big wave B.  In this case, it will be the wave-b of bigger wave-B (in your chart).  Then the market will move up to your chart's 50% to finish wave-B.
1

评分人数

ooooopse
Just read it
How I feel SILVER will be down tomorrow
Like your posts even not fully understand
lol
~心宽灵深爱永远~
The following is a discussion in some other forum:

snowrider, can you please share your U/J weekly or monthly count? I'm interest in this chart, but do not know when to begin. My chart begin at 1 Apr 1989 and it's hard to count this chart ( impluse or corrective wave???)


Please see the attached chart.  One of the reasons that JPY is not easy to count and to trade is about its current wave.  From the chart, you can see that it has formed a huge triangle since 1994.  I count that triangle as wave-[[IV]].  The current wave could be the wave-[[V]], which is ending the long term appreciation of Yen.

1

评分人数

06/11/2011

Comments are welcome!


1

评分人数

Thanks!
I like your post!

06/18/2011

Comments are welcome!


1

评分人数

06/22/2011

Comments are welcome!

EUR - The preferred count not changed yet
JPY - The preferred count not changed yet (but the alternative count might be taking over)
Gold - The preferred count not change yet.  We might have seen the peak today (06/22/2011).  Next move is a crash.
SP - The preferred count is still long term bearish.  The best move for big bear is a false break to upside then crash - peak at around Friday noon.

20110622 SP - Intraday.png (97.27 KB)

20110622 SP - Intraday.png

1

评分人数

返回列表