Record Oversold Levels Mean It's Time to Buy
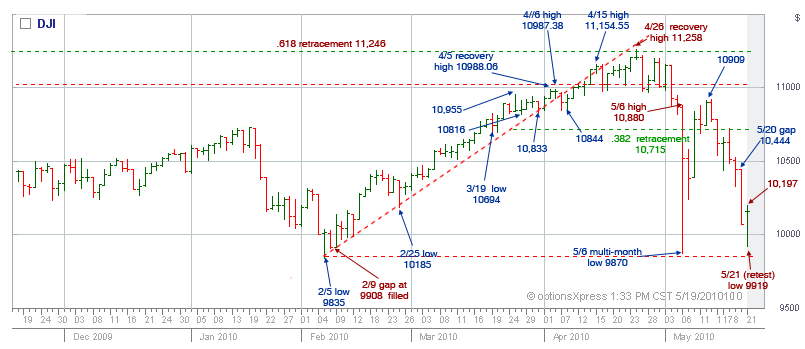
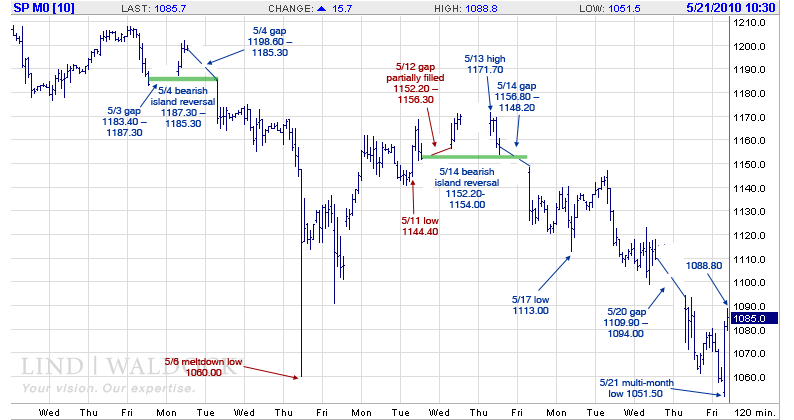
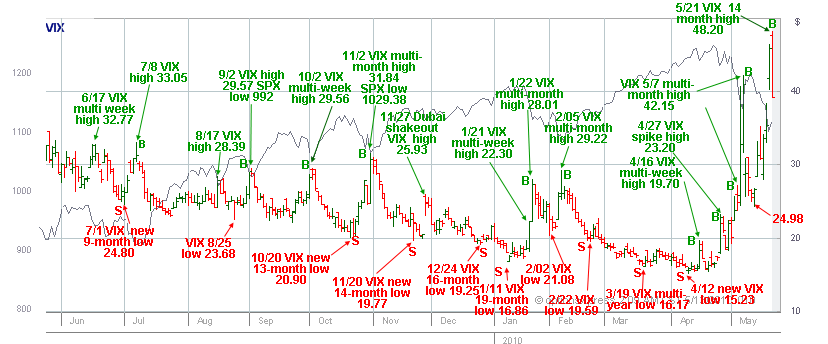
已有 13578 次阅读 2010-05-23 00:18 标签: Record Buy Levels Mean OversoldTechnical Analysis In addition to looking pretty bad, some good things have already happened this morning. Notably, while the S&P 500 and the Nasdaq Composite (and the Russell 2000) went to new lows, the Dow held narrowly above its comparable lows at the 9870 level. The Dow bottomed at 9919, about 49 points above its May 6 meltdown low. This occurred as the S&P and Nasdaq made lower lows. That rates as a minor non-confirmation, which bulls will say is a bullish non-confirmation (bears might have a different take on it). Of note, not only did the Dow fail to confirm the new lows in the S&P and Nazz, the Nasdaq 100 (NDX) also didn't make a new low. The low today in the NDX at the 1768 level was about 16 points above the May 6 low of 1752.31. So that's another non-confirmation. This is the kind of thing we often see at market bottoms: some indices making new lows, unconfirmed by others. (I would have preferred that it was the S&P that didn't make the lower low, but we'll have to take what we can get.) Speaking of the S&P, note in the chart above that the S&P futures made a new low by 8.5 points and has now rebounded to the 1088.80 level. That's a serious bounce, and one that I am not taking for granted. In fact, I'm hedging some bullish bets as the market pops up toward yesterday's big gap, which runs from 1094.00 up to the 1109.90 level. A move into the gap should point higher, presumably further into the gap, but the S&P must fill the gap and close above it to signal "all clear." As you know, another positive development during the recent meltdown has been the heating up of bearish sentiment. Of course, there was considerable complacency evident in recent weeks and months as the market continued its stair-step advance to higher and higher highs. That complacency has now been pretty much replaced by fear and anxiety as the world looks for the next shoe to drop in Europe, and for the U.S. market to topple like a domino. No surprise, the sentiment indicators -- at least of the short-term option variety -- have exploded to new bearish extremes of the past one to two years. The CBOE Market Volatility Index (VIX) again provides the best graphic illustration of this -- it spiked to new 14-month highs at 48.20 earlier this morning. I rate this development as bullish. Then there's the market's oversold condition -- boy, is it ever oversold! Apparently, we have no bullish divergence for the McClellan Oscillator, which not only registered new oversold lows for this move, but new lows for all time. Yesterday's reading of -426.47 is the most oversold reading on record, narrowly eclipsing the previous extreme set in October 2008 at -421. These oversold extremes are not always slam-dunk buying opportunities, as they occasionally lead to accelerated declines. But the high-probability bet to follow a number like this is that the market rallies. And that's the bet I am making.
Record Oversold Levels Mean It's Time to Buy
By Harry Schiller
RealMoney.com Contributor
5/21/2010 2:30 PM EDT
URL: http://www.thestree t.com/p/rmoney/ technicalanalysi s/10763983. html
For just a moment, step back from all the handwringing about how the stock market is now "officially in a correction," and the headlines about the coming end of the euro and the end of Greece and the other PIIGS. Step back and recall how things looked in March 2009, and remember how there wasn't a glimmer of hope for the market. The conventional wisdom was that "this time is different" and "this really is the end of the world" and that the stock market would never recover.
Seems like a long time ago, but yet the tone now is eerily familiar, isn't it? It's really a very similar tone today. Lots of similarities, though this time the market hasn't just suffered its sharpest decline since the Great Depression. This time it's just about a 13.5% pullback from the highs -- pretty standard stuff.
So what's the problem?
Well, for one, the news is grim. Check. Also, the market looks awful (check) and it keeps dropping every day (check again). So again, what's the problem? What buying opportunity do you recall that looked really good? That is, do you recall a great buying opportunity occurring when the news was grand and the market looked great with all indices making new highs? I don't recall ever seeing that. In fact, the market looks awful at its lows. That's the only way it gets down there -- bad news and lots and lots of selling. That's what we should expect at a bottom: a really ugly picture with horrific breadth and indices at new multi-month lows (check, check, check). True, you can have positive divergences at the lows and some nice technical stuff happening, but in general, at least to the naked eye, the market looks pretty bad when it is bottoming. That's its nature.


发表评论 评论 (0 个评论)