这些数字是你标上去的吗?
not4weak 发表于 2011-7-2 11:05
...
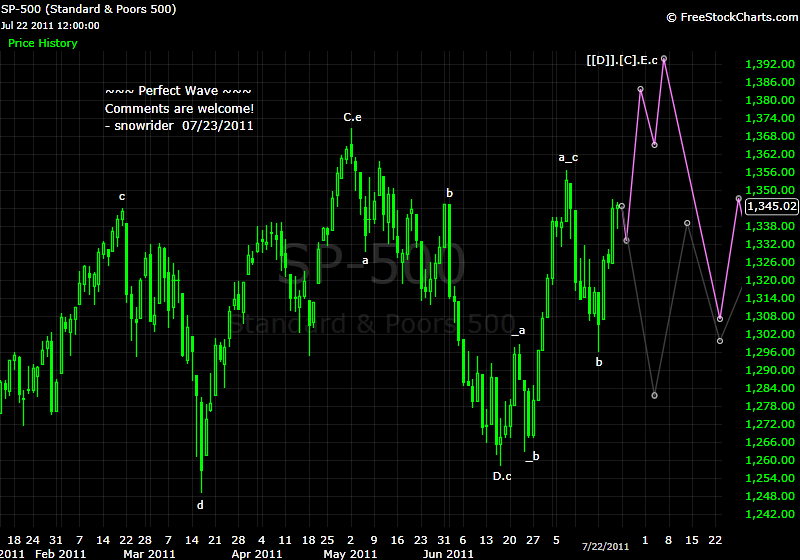
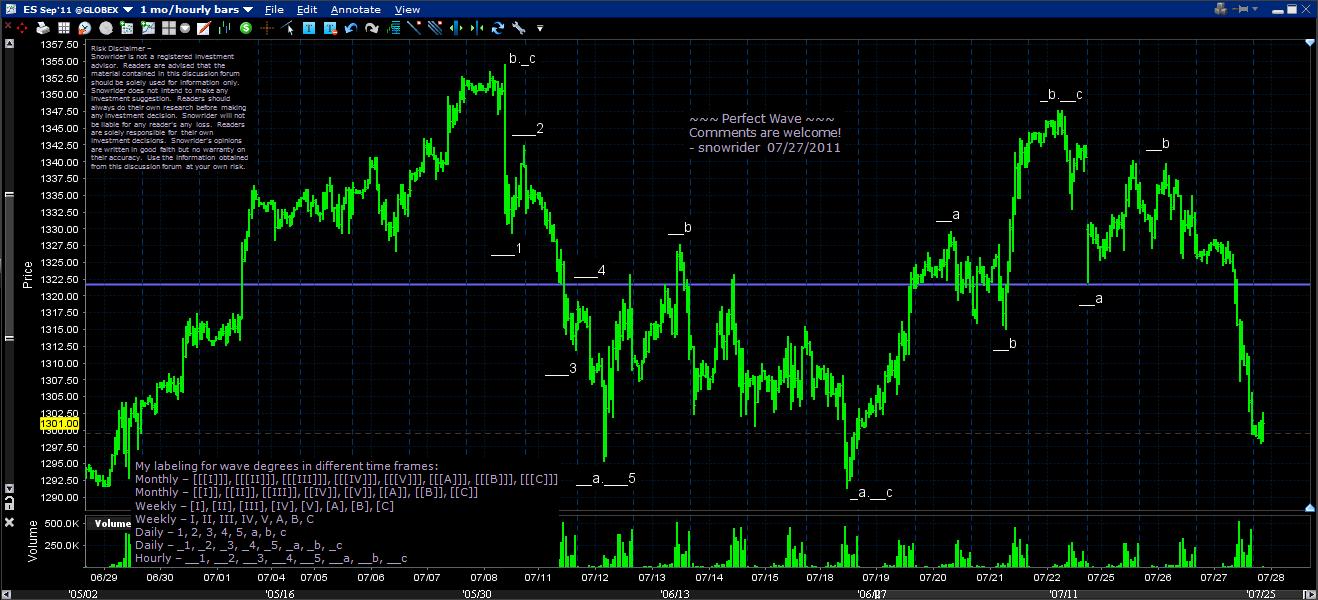
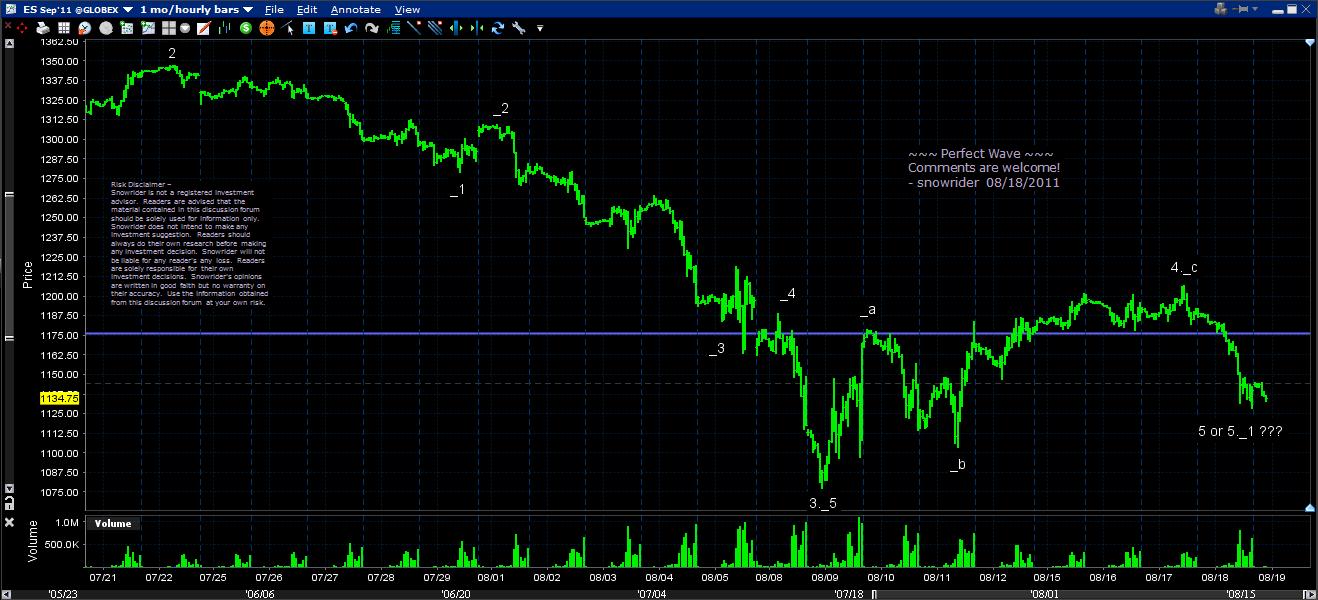
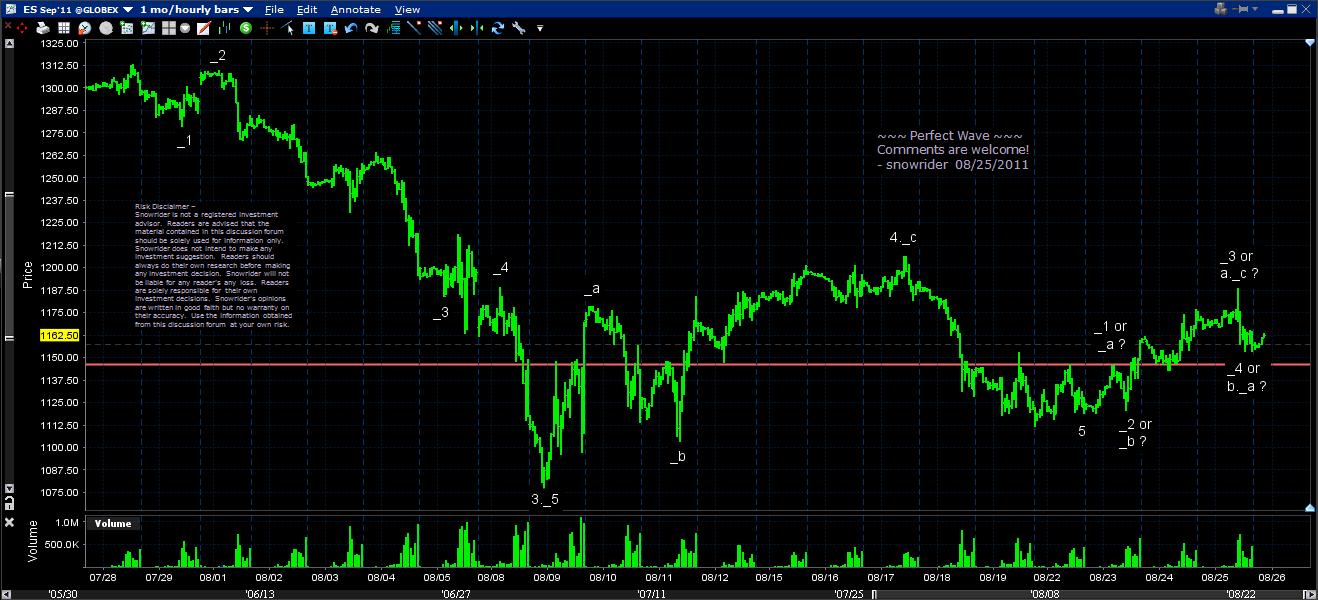
One thing puzzled me is on EW charts, I seldom see the market in range, always up and down. From my observation, market can just trade sideways for sometime after a big run and resume the trend, not necessary get busted.
...
看不懂。。 要不你就这十天图来讲讲 那一段算corrective, 那一段算implusive?
...
这些数字是你标上去的吗?
not4weak 发表于 2011-7-2 11:05
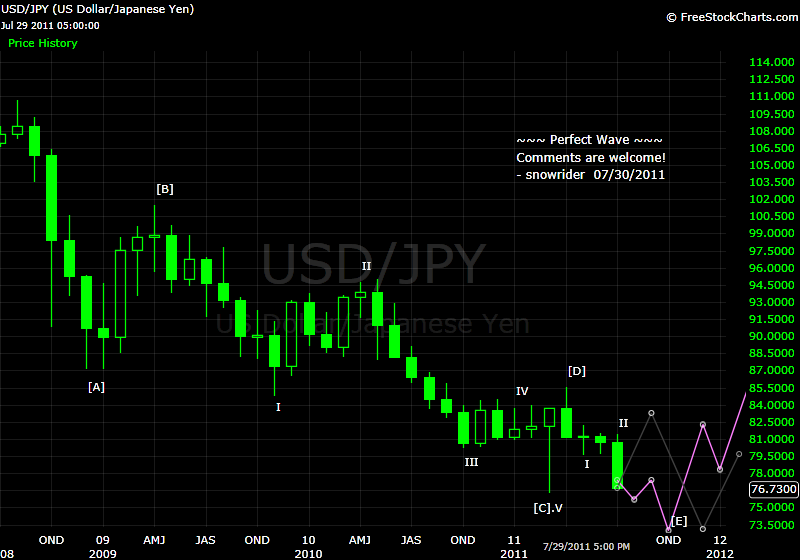
这个E Wave 在外汇市场上是被广泛应用,不过据我观察, 基本上 50-50, 事后诸葛亮。 这些东西就是偶尔很好用 ( 比如 02年的大盘 就很是按 它走的 )多数的时候不灵光。 问题得关键是你事先不知道啥事后灵光, 啥时候不灵。
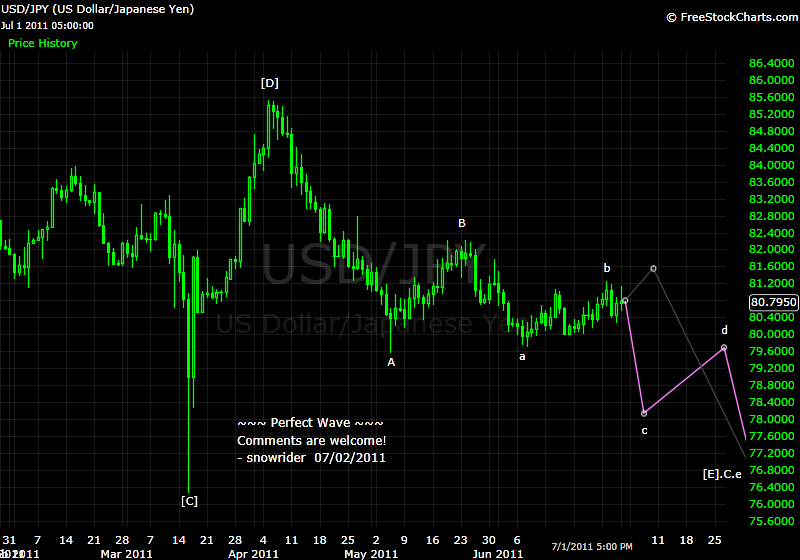
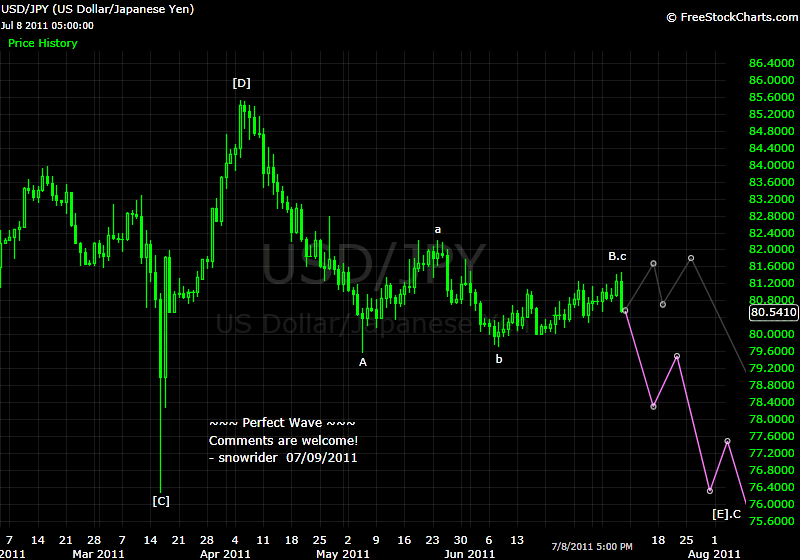
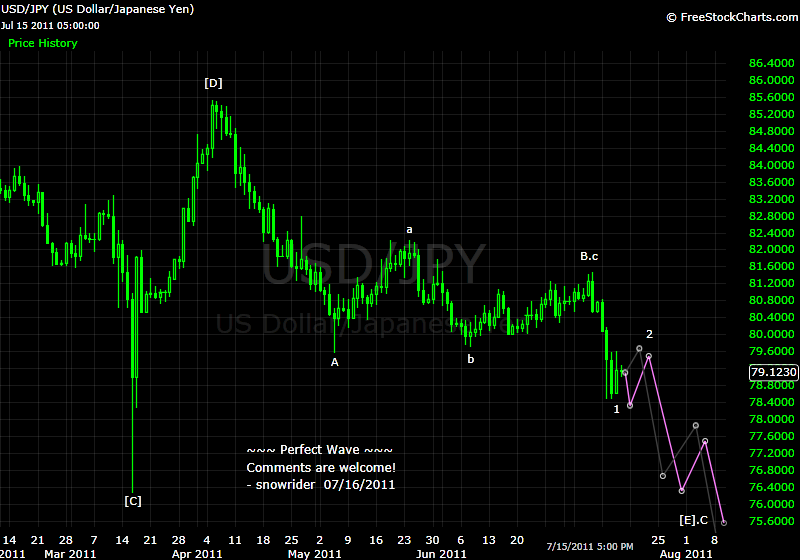
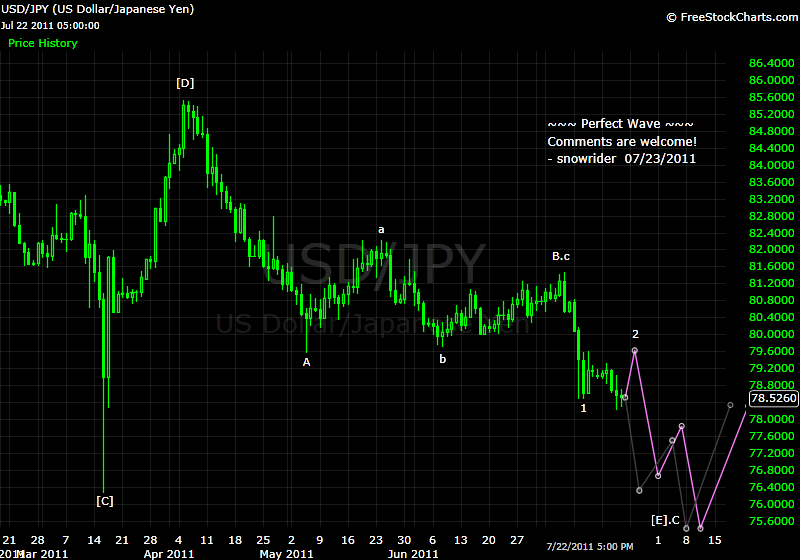
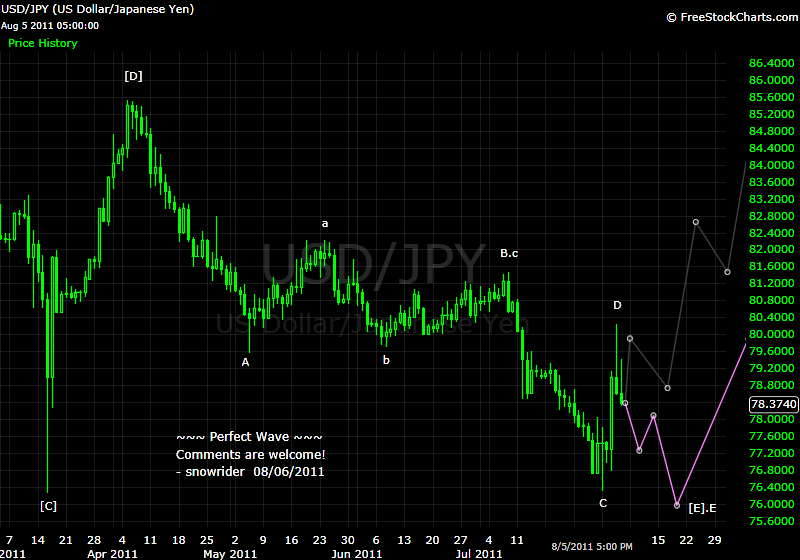
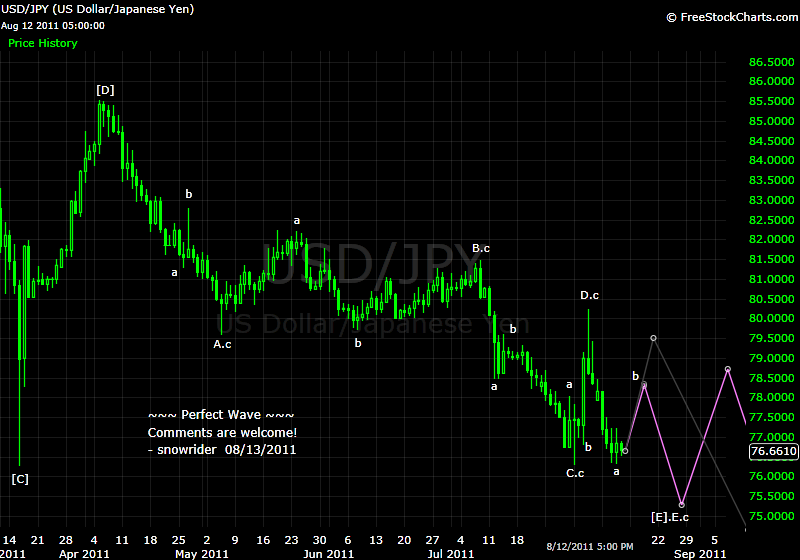
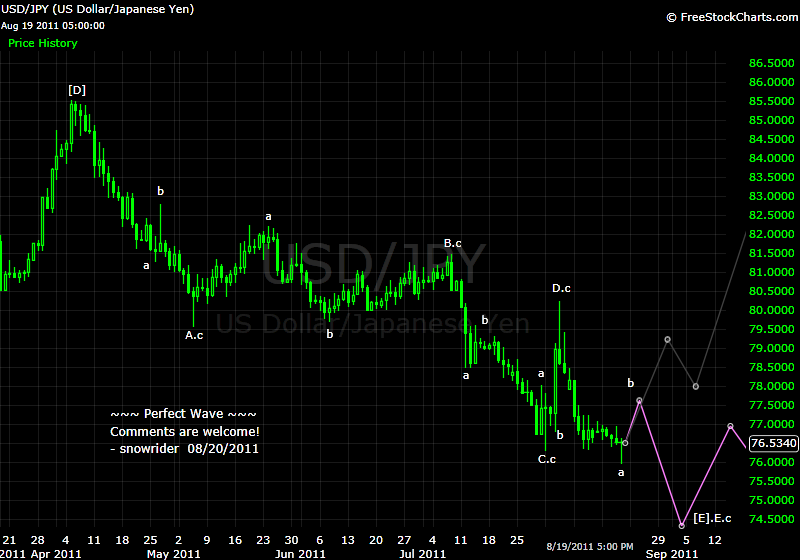
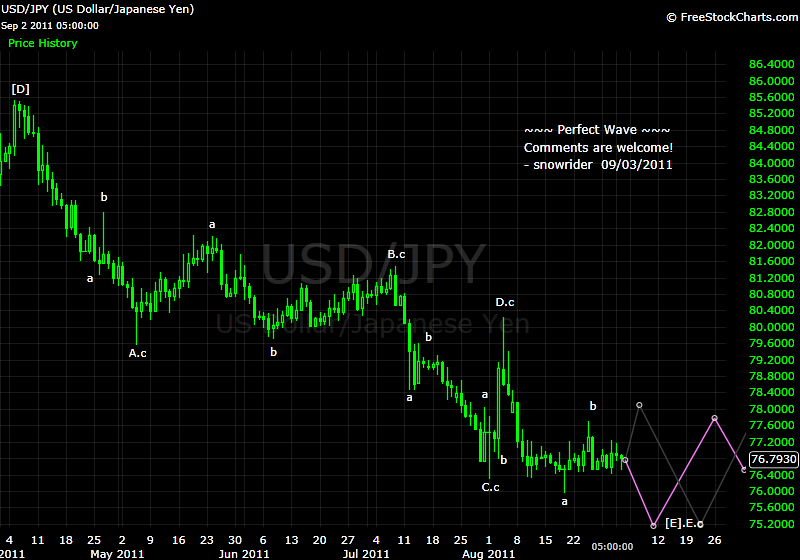
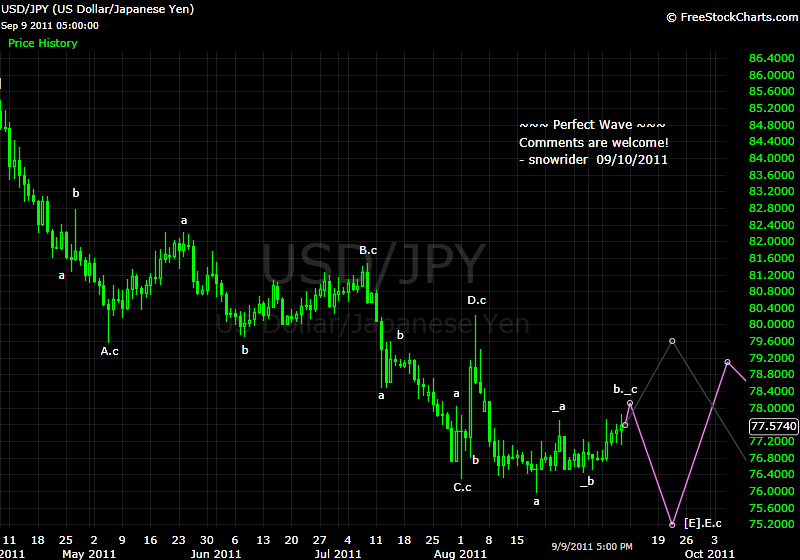
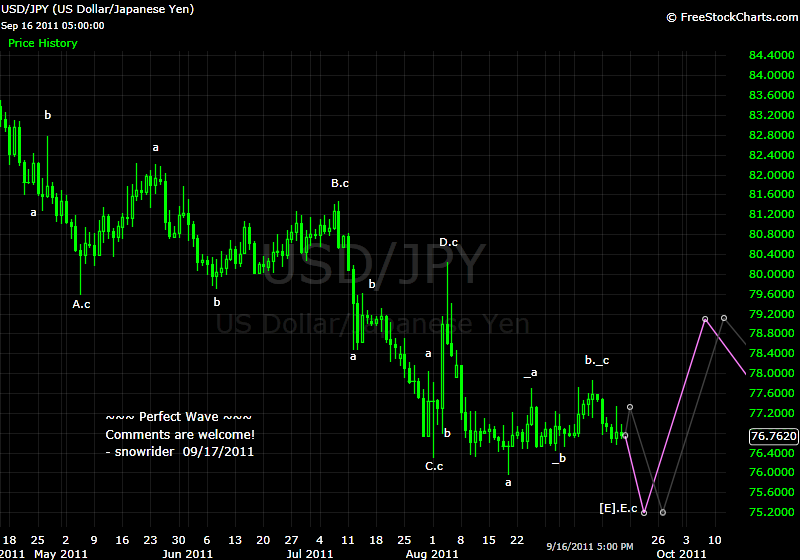
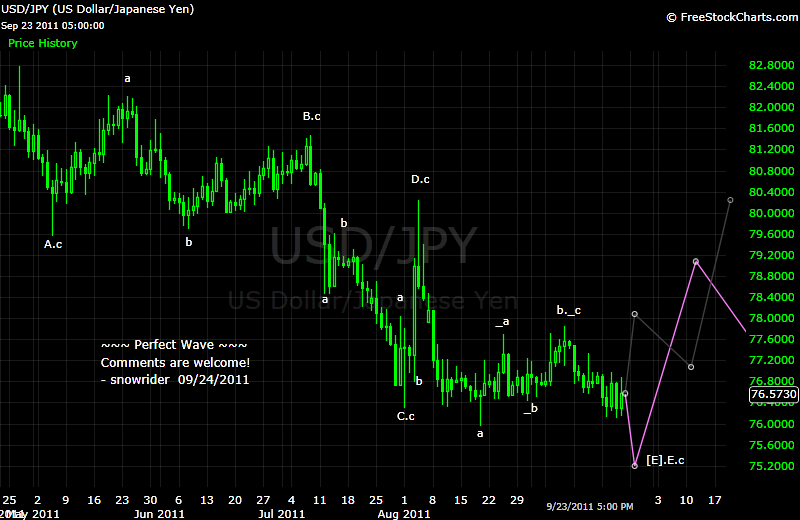
日元下到80以下不容易,也就地震那几天,现在可不大有这个机会
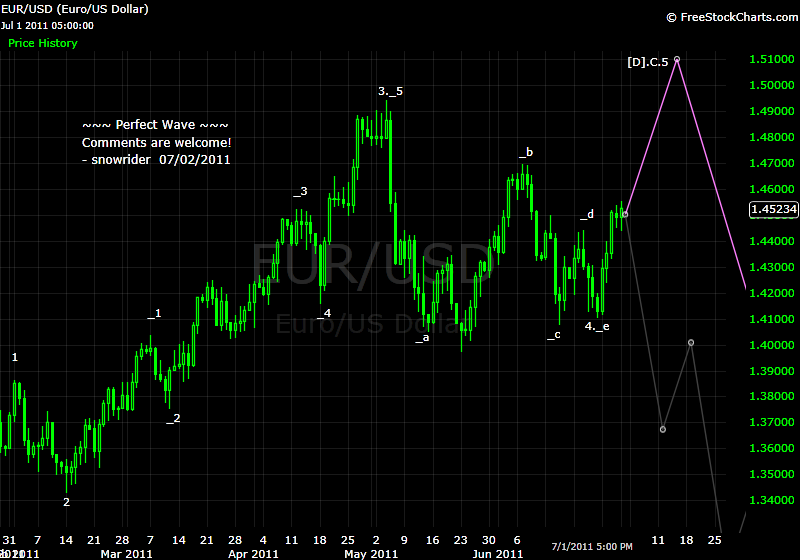
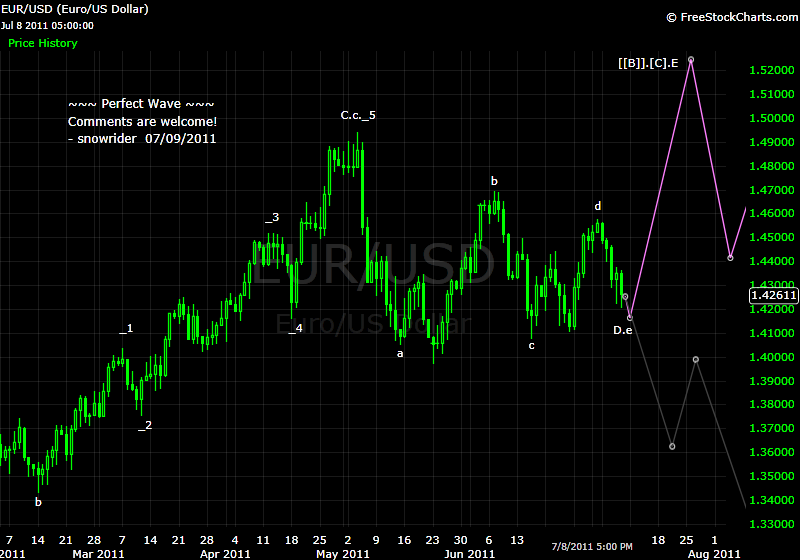
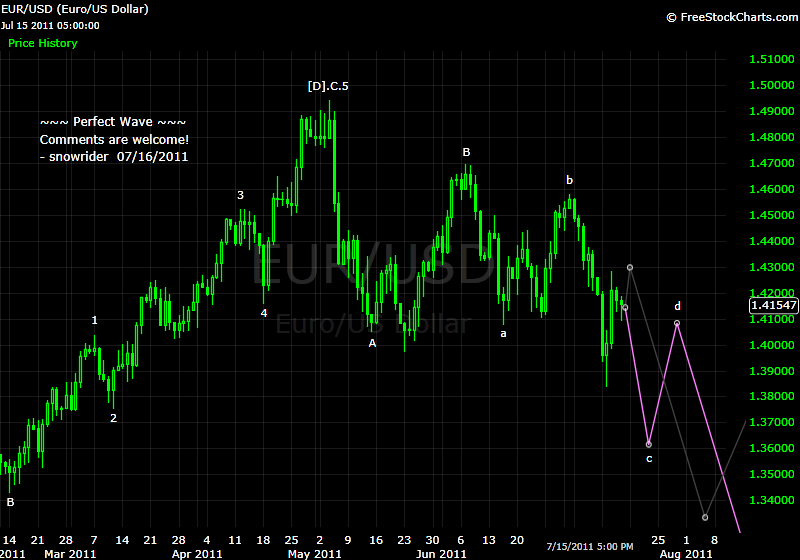
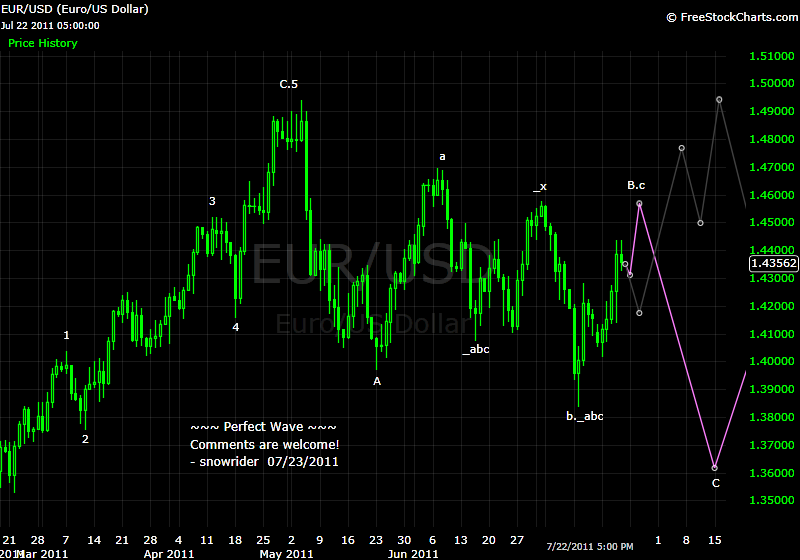
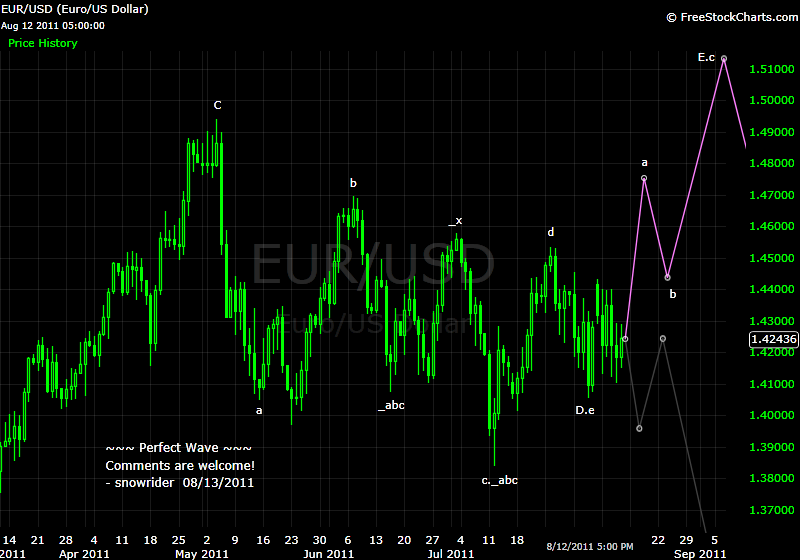
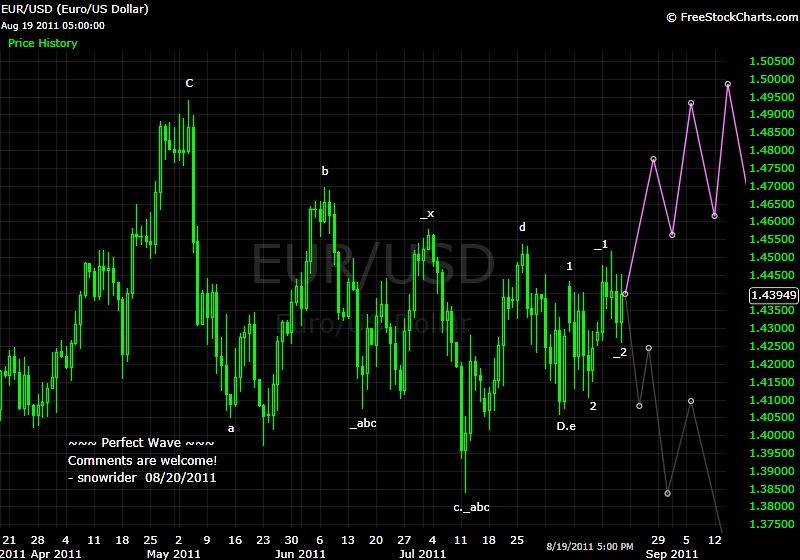
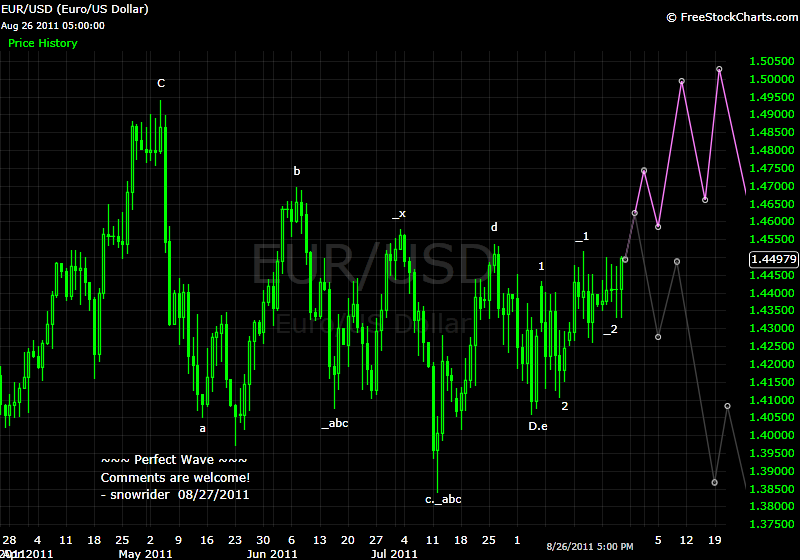
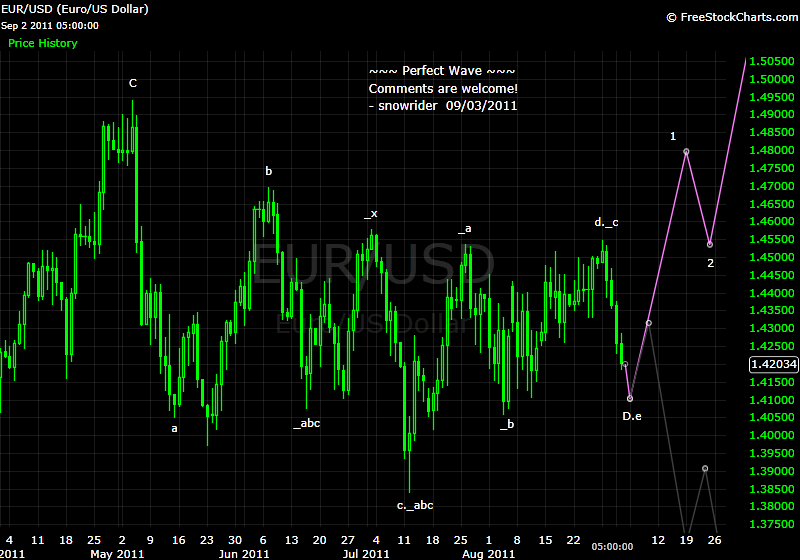
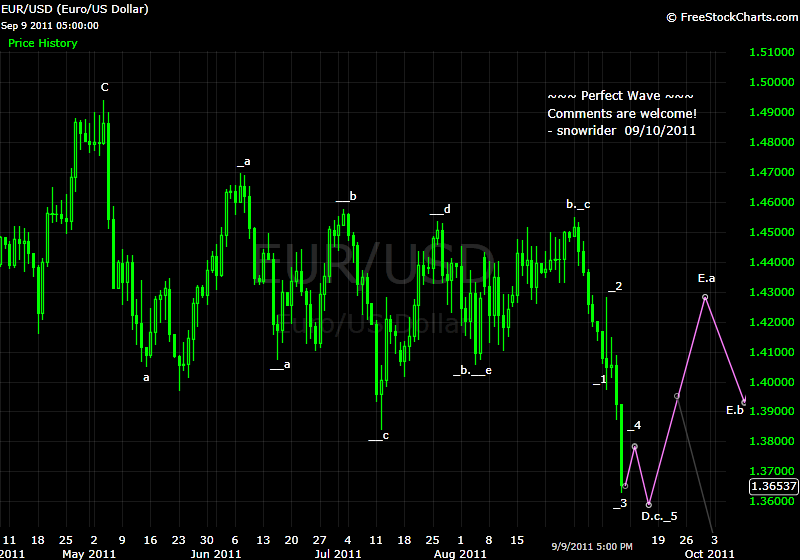
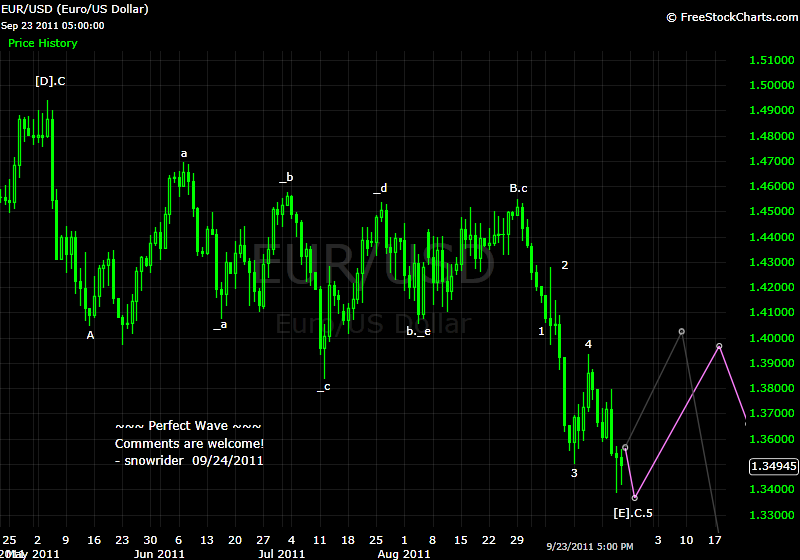
同理,我也对欧元上1.5有有疑问
... 我也觉得是心理暗示更大一点。读图靠经验和pattern
这东西太复杂了,我弄几年了还没弄太明白,而且短期交易会受到影响。有bias就不好飞苍蝇了。

Since you ask for comments here are mine:
I find Elliot Wave absolutely useless as a predictive tool. ...
... It is imprecise both in terms of price and time and is always subject to more than one (often contrary) interpretation. How often do wave counts have to be re-numbered?
...
...
I can see that there is some relevance in using it as a descriptive tool regarding what has happened, but do not see how it is possible to use it to make correct investment or trading decisions....
...
good effort
realy i thank you
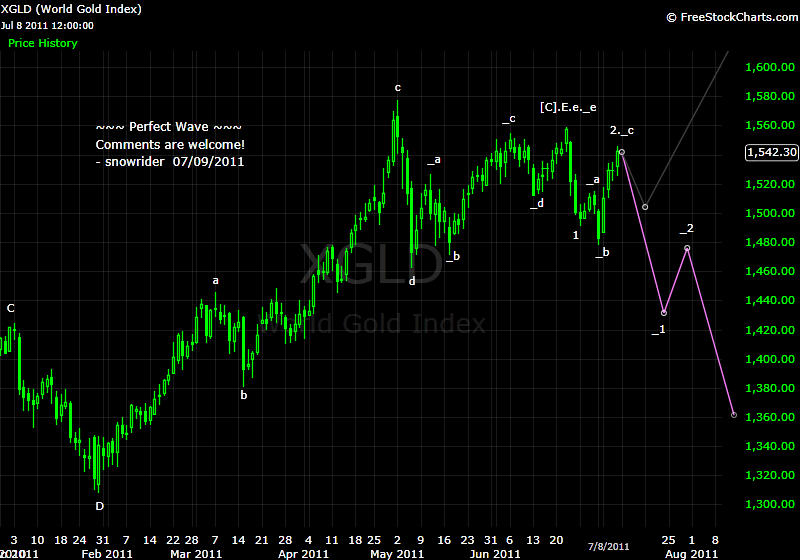
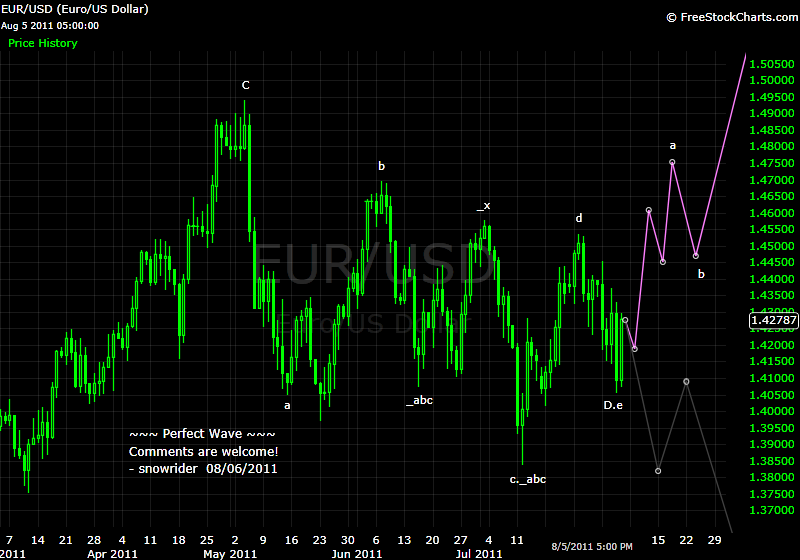
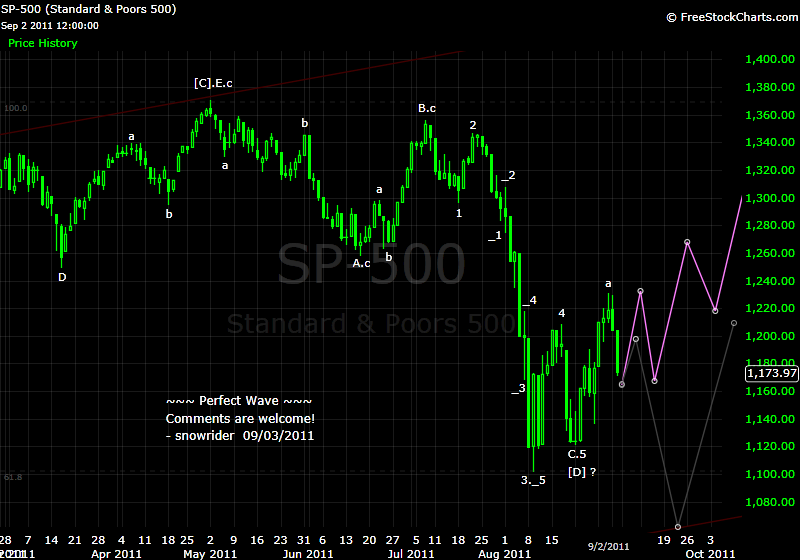
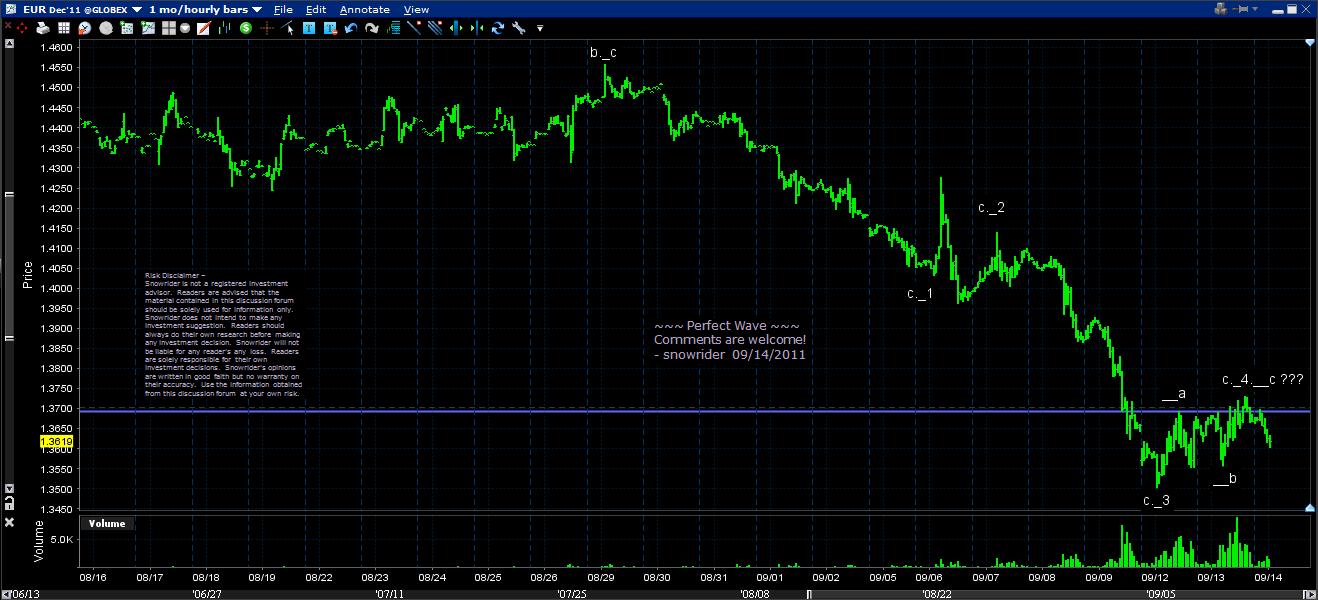
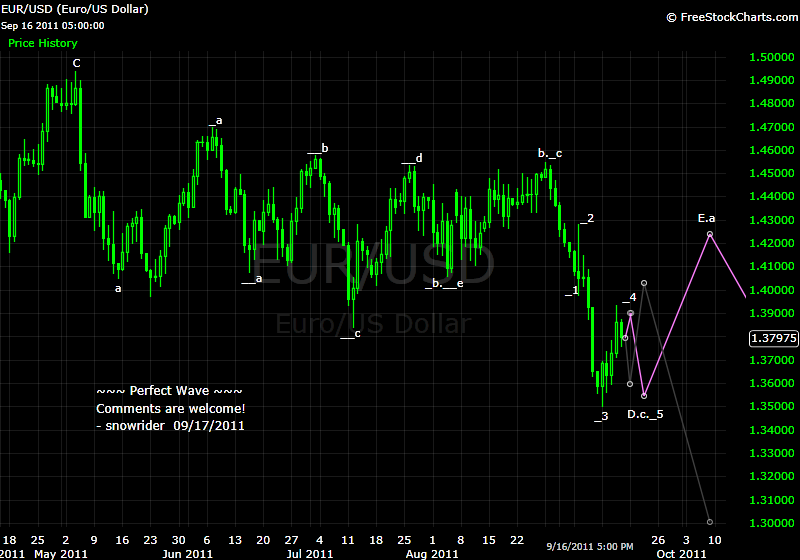
could you please just explain to me what did you mean by
a , b , c , d in first chart !
as i know there is no D in Elliott Wave Principle
Do you mean it is impuls ?
thank you again
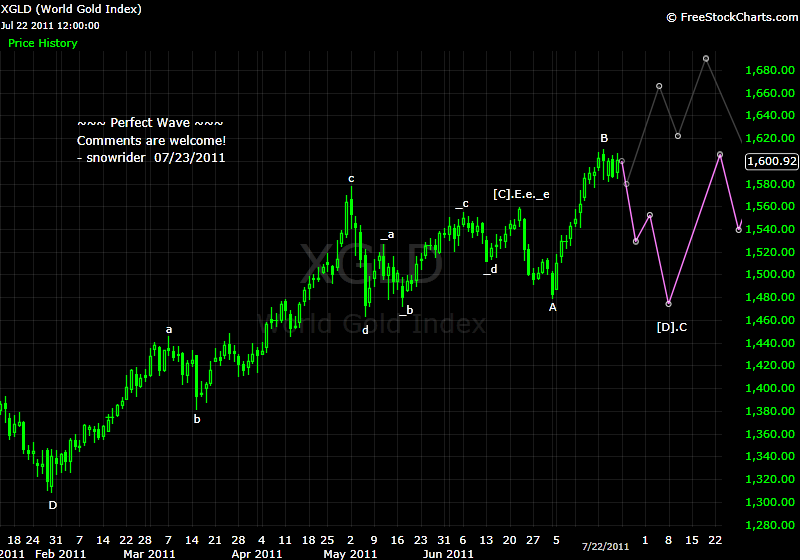
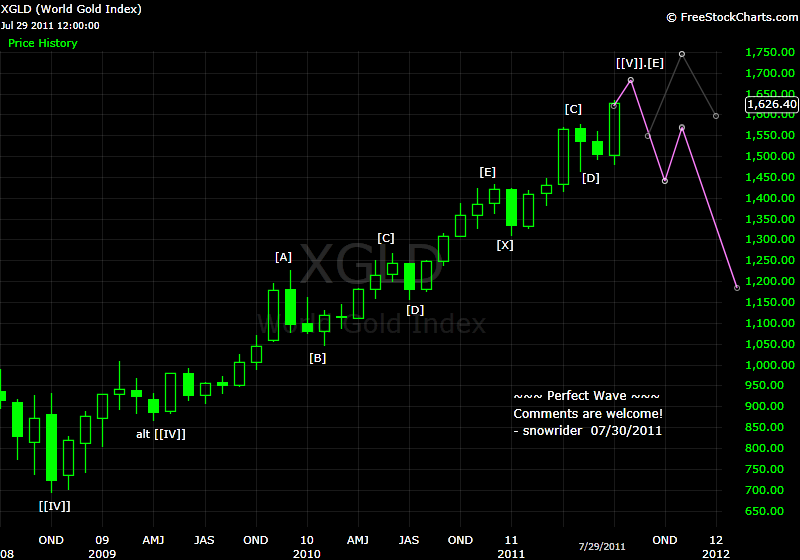
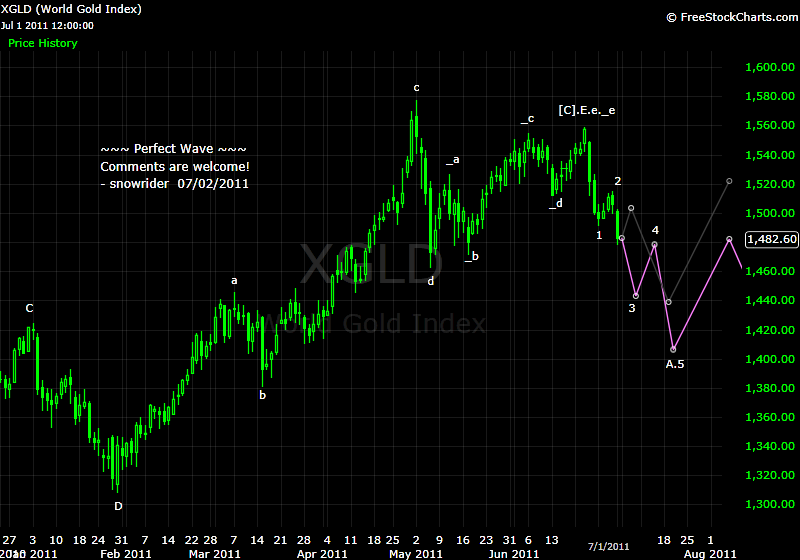
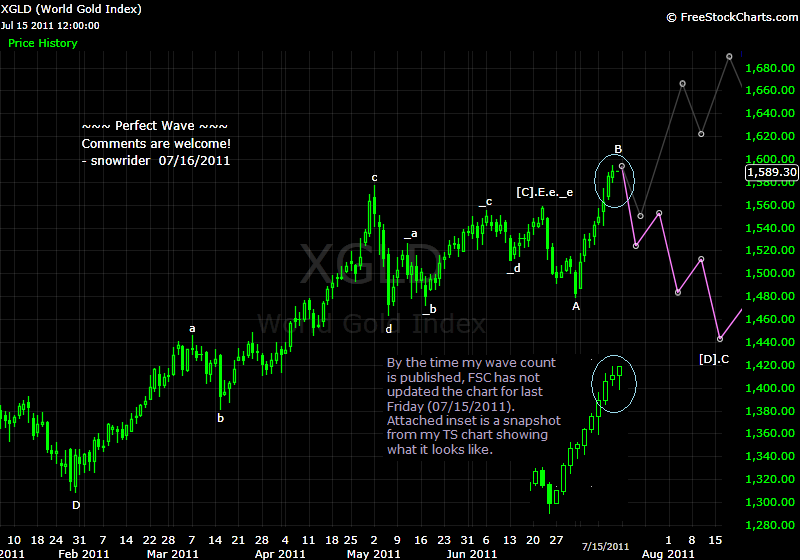
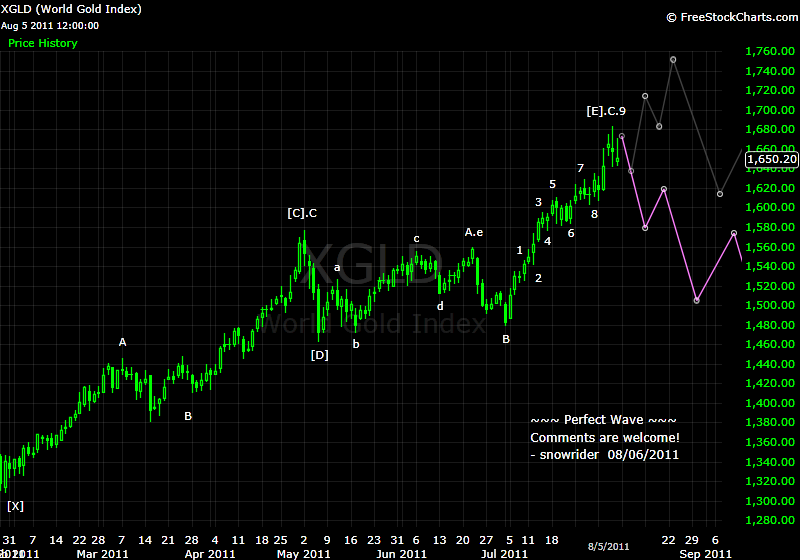
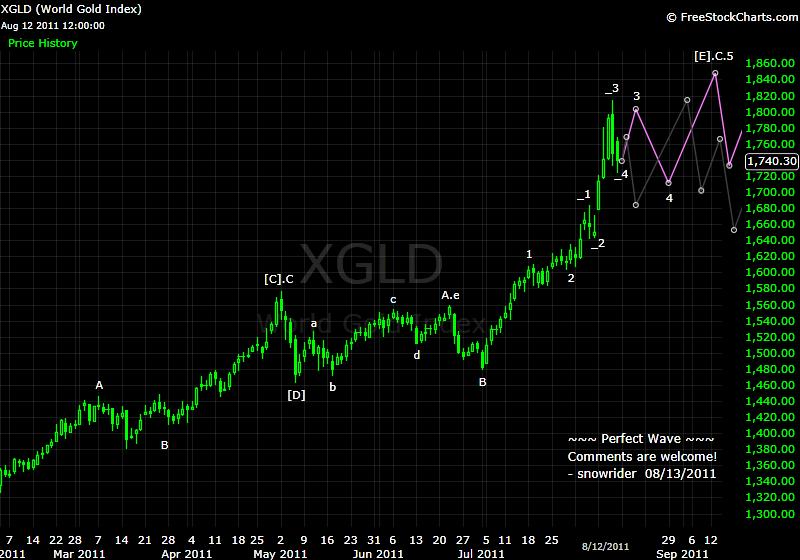
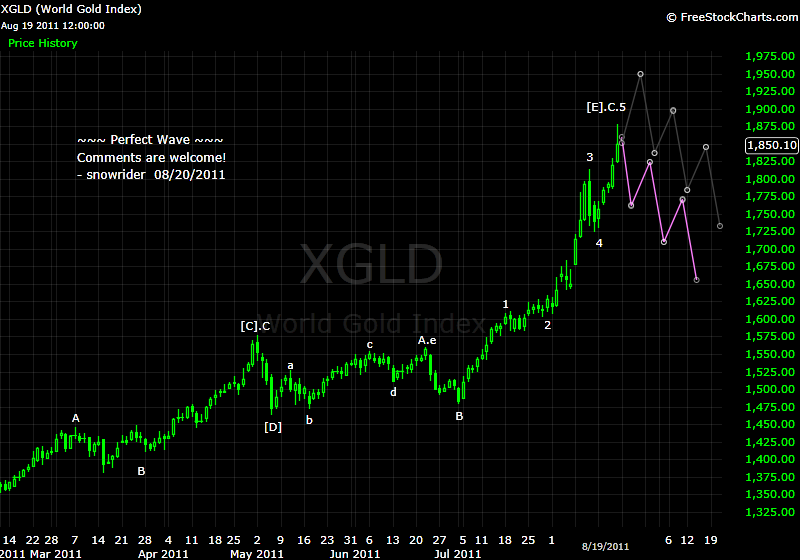
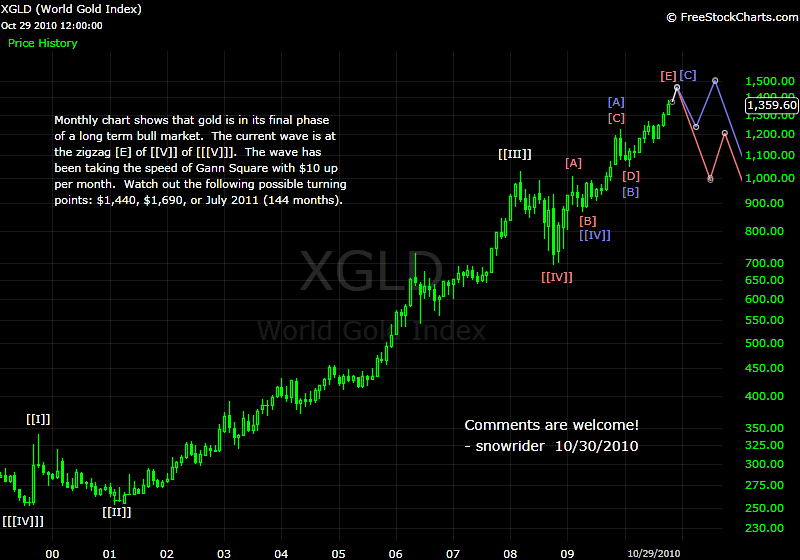
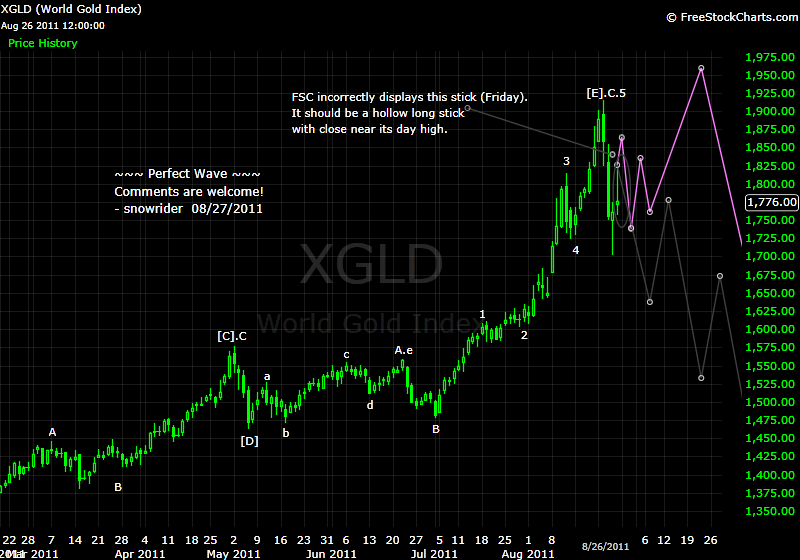
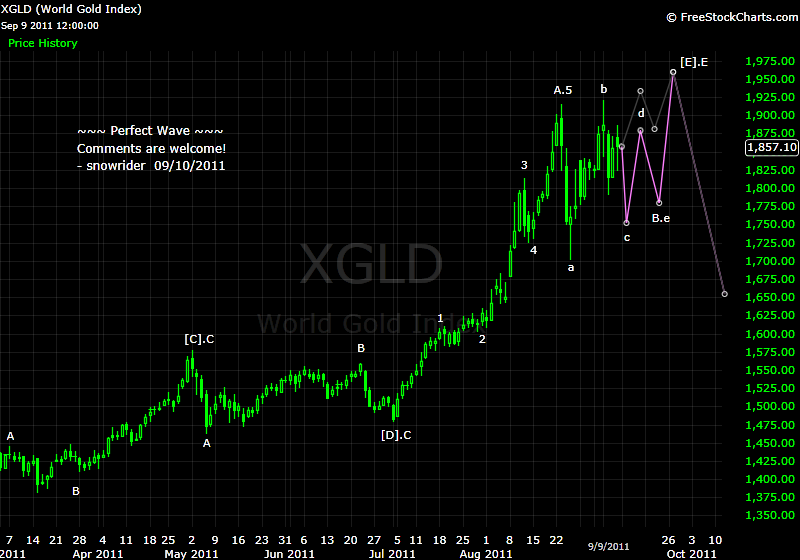
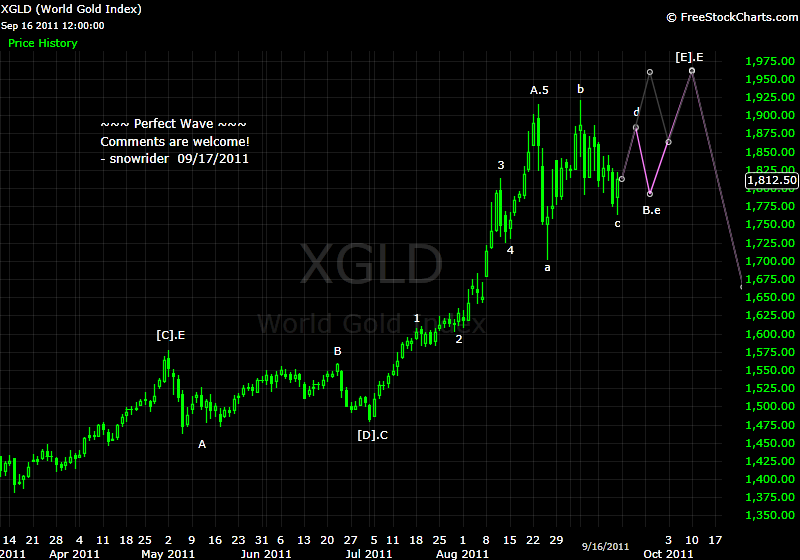
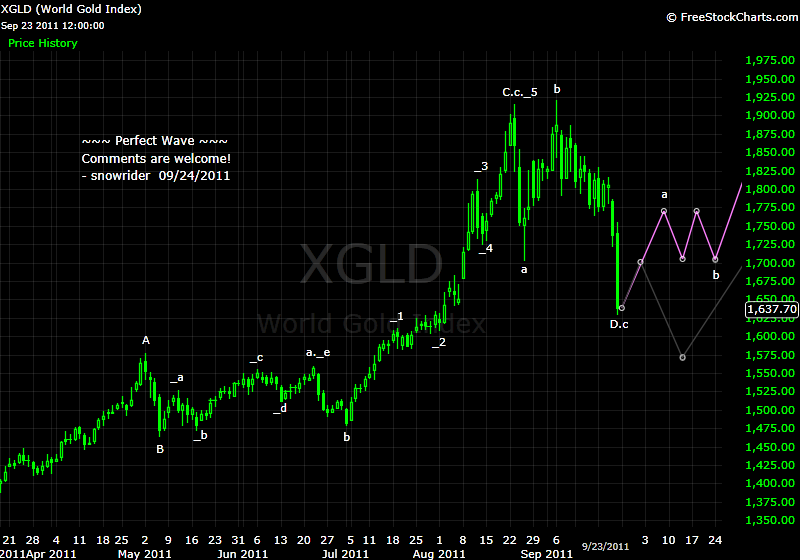
金子到 1200? that is impossible
黄金的价格是有基本面支持的 ... 现在的买家跟hunter 坐庄银子时候是不一样的。
...
... 但那将是买实物黄金的好机会。 把手上的纸币换成实物肯定不会错的。
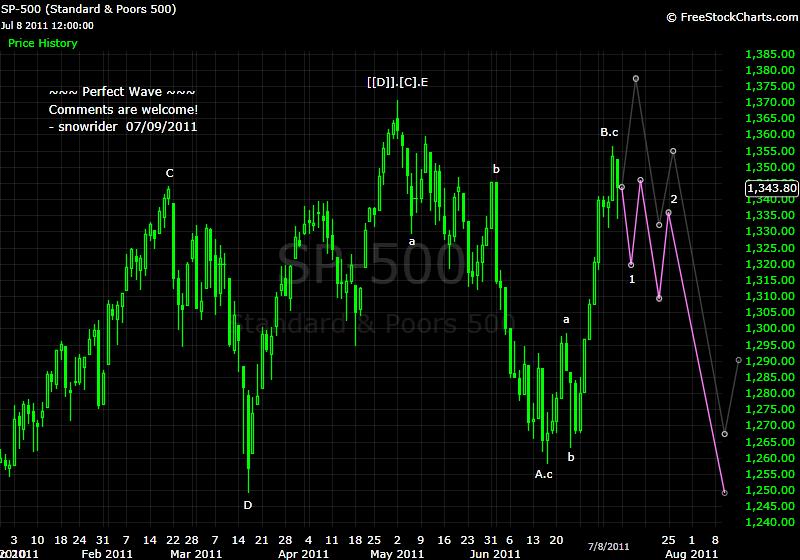
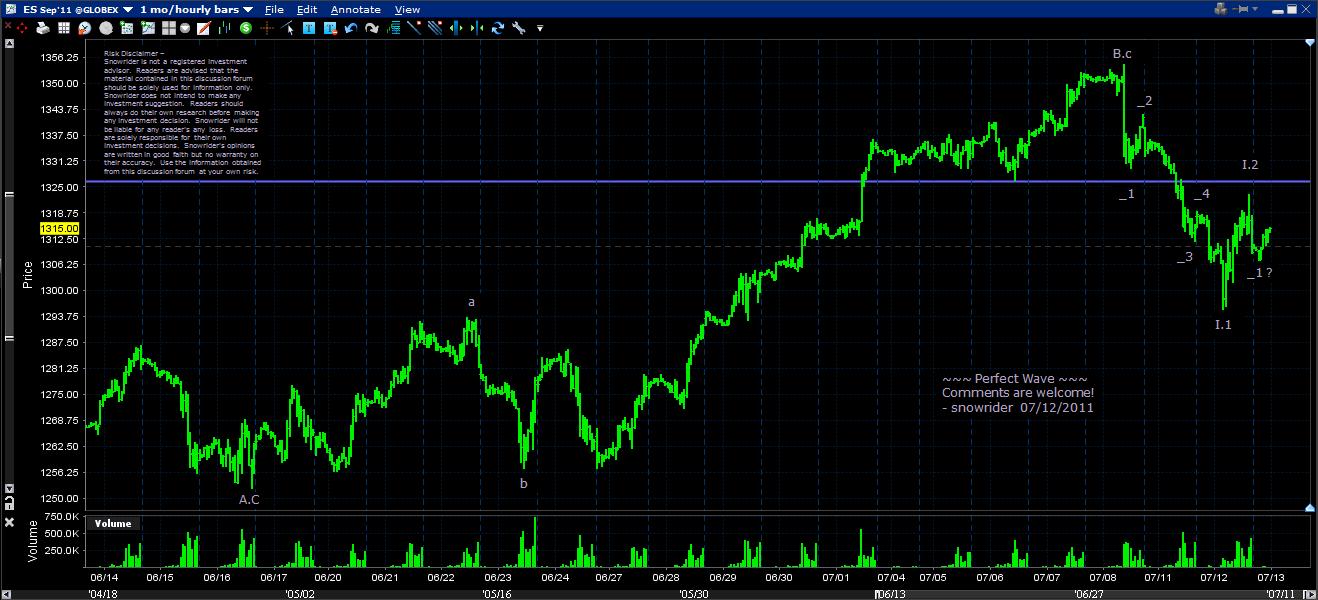
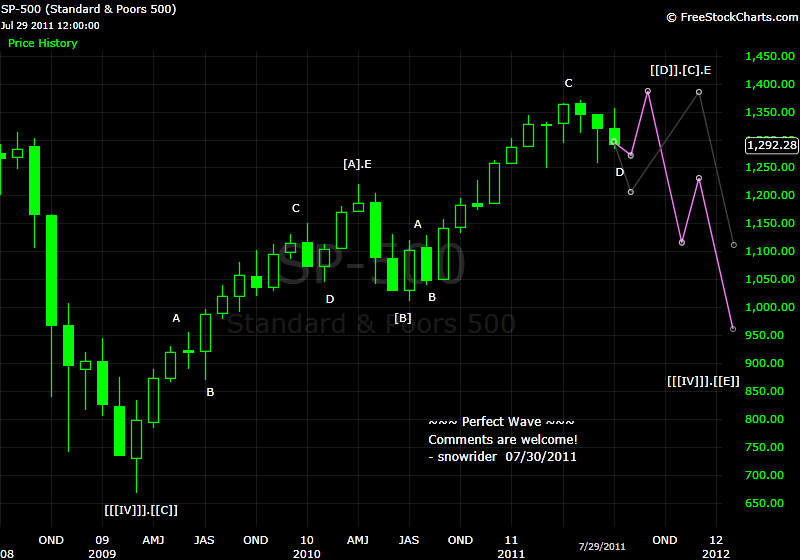
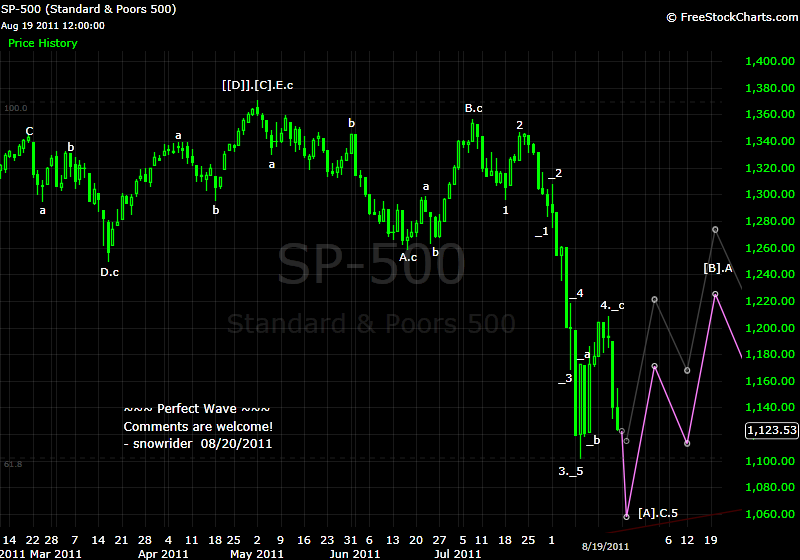
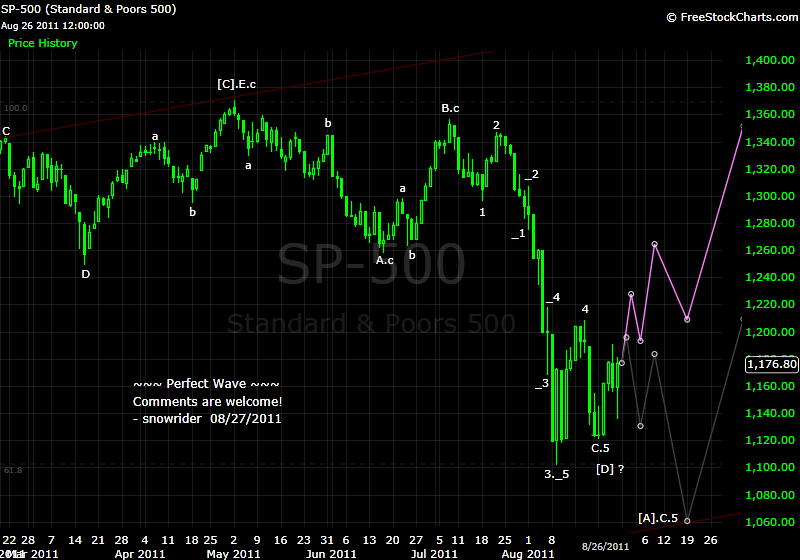
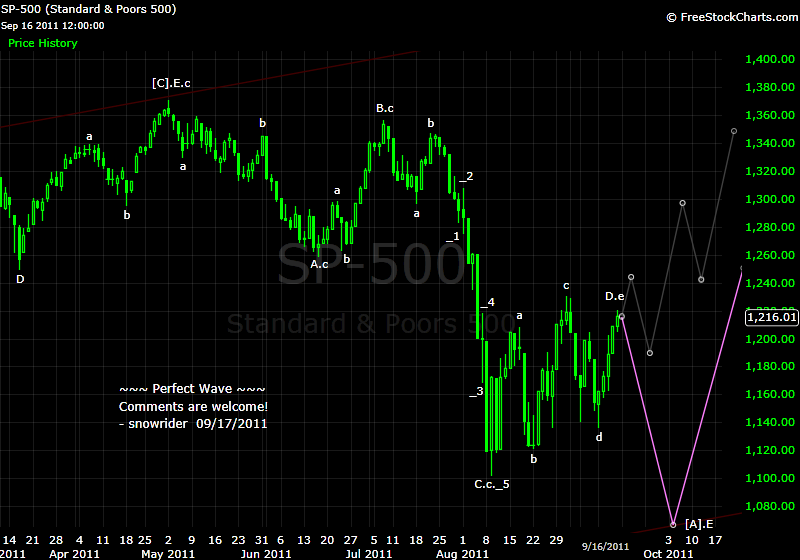
有新的路线图更新吗?准确率很高啊,就看spy能不能真的上1400了
moonpig 发表于 2011-8-7 14:09
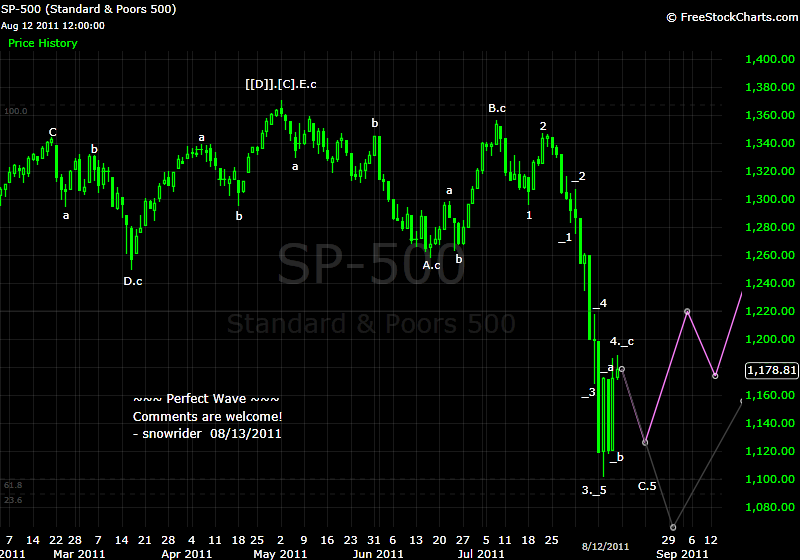
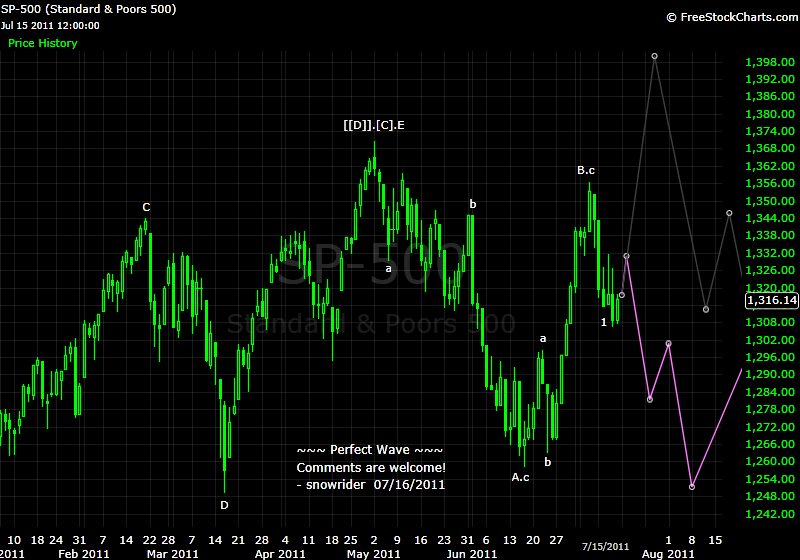
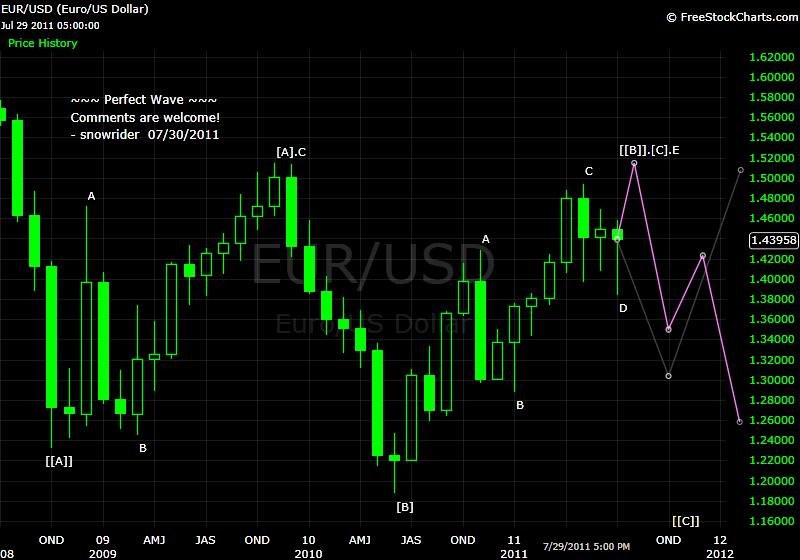
you label the down trend as abc, so the primary trend is up? can you explain the big picture?
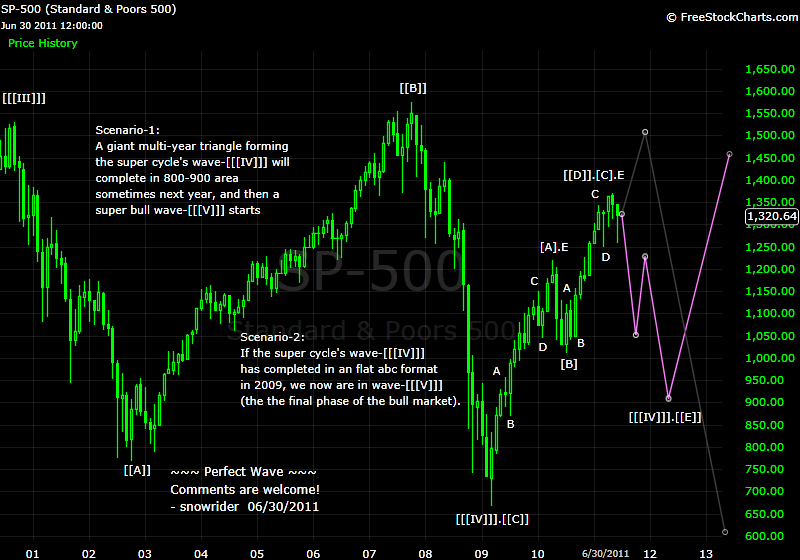
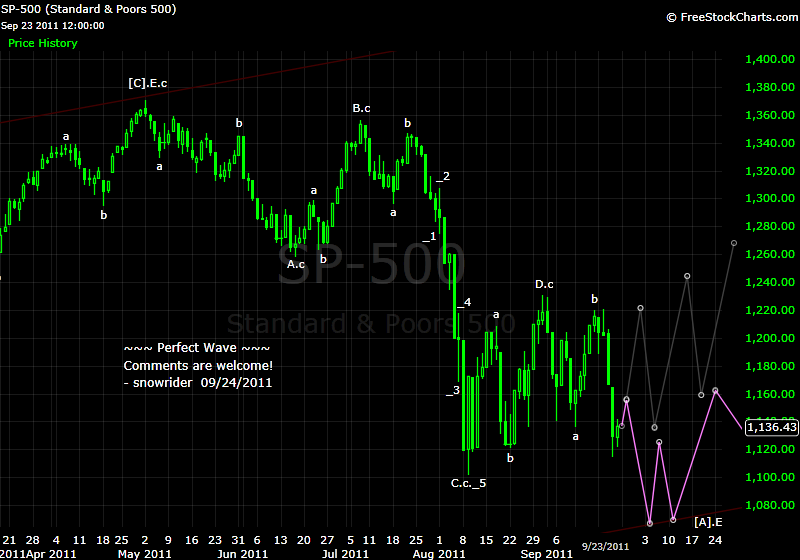
当[[D]].[C].E 完成后 ...
第一张图标志的是A-B-C,后面还应该有反弹浪-D和下跌驱动浪-E的出现
那么,比较一下下面的图,两者在08年迄今的范围里,应没有什么分别吧?
如果没看错,结论是:
现在刚走完[[[IV]]].[[E]].[A].C,接着走[[[IV]]].[[E]].[B],最后在前期高点以及费波纳契的61.8%处完成[[[IV]]].[[E]].[C]。至此,一轮新牛市再次展开。
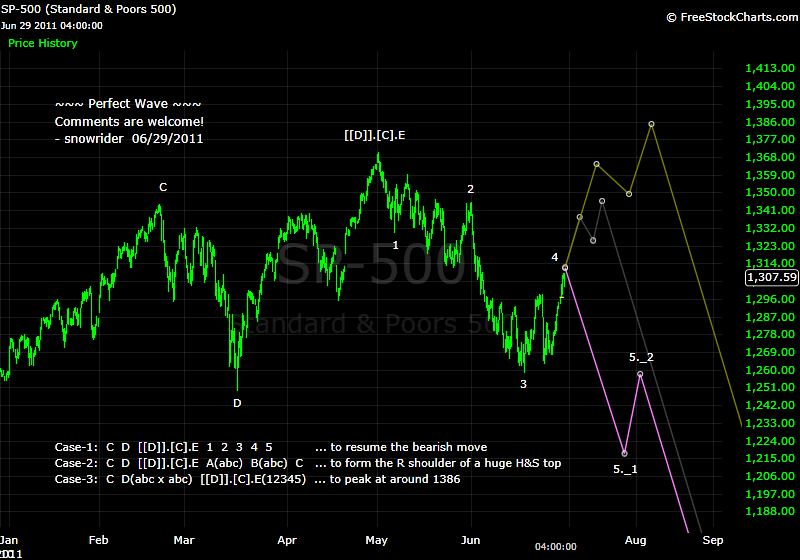
我的问题是:从[[D]].[C].E.起始的 [[[IV]]].[[E]].[A]浪常态是驱动浪型态,即5浪型态,这是一个重要条件。所以后面会跟出反弹浪D和驱动浪C。
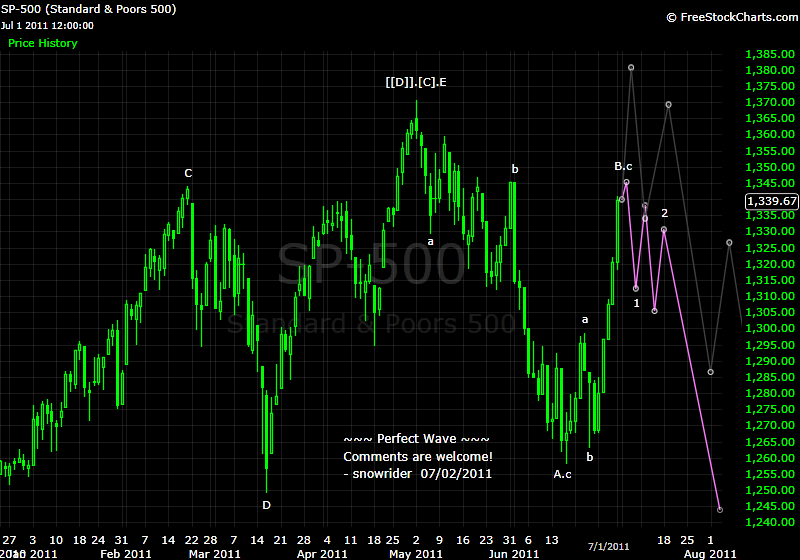
而接下来的调整浪[[[IV]]].[[E]].[B]才会是A-B-C型态。
...
...
从第一张图的[[E]].[A].A.到[[E]].[A].C.的形态上看,特别是A与C之间角度的过分差异,是驱动浪的1-2-3(后面还有-4-5)型态。
... 为什么[[[IV]]].[[E]]是A-B-C型态,是因为[[[IV]]]这个复杂浪段通常以反弹浪A-B-C作结尾的吗?...
thank
bullish eyes
aimei 发表于 2011-8-25 22:23
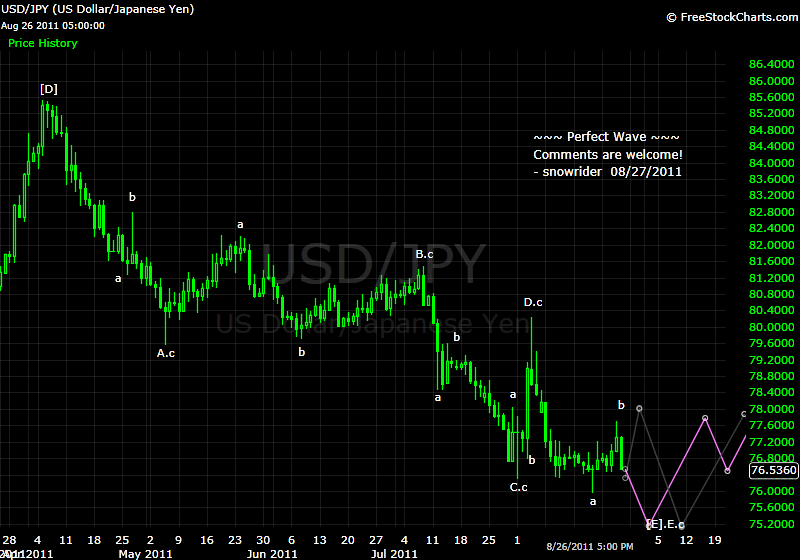
USD/JPY对大盘有何指导意义?
我想你短期看牛,中期看熊,,,,到明年变成大牛...

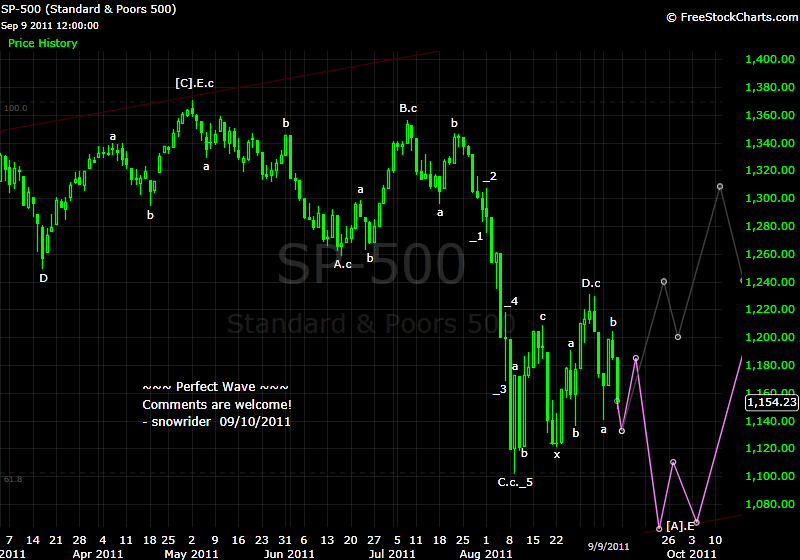
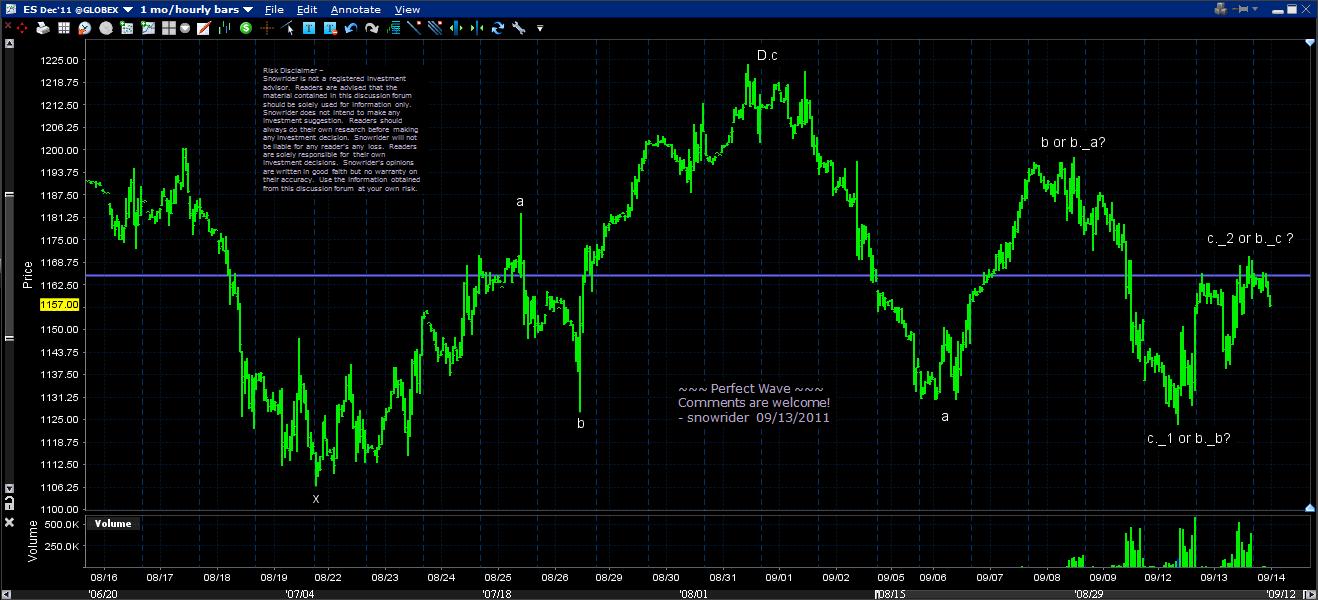
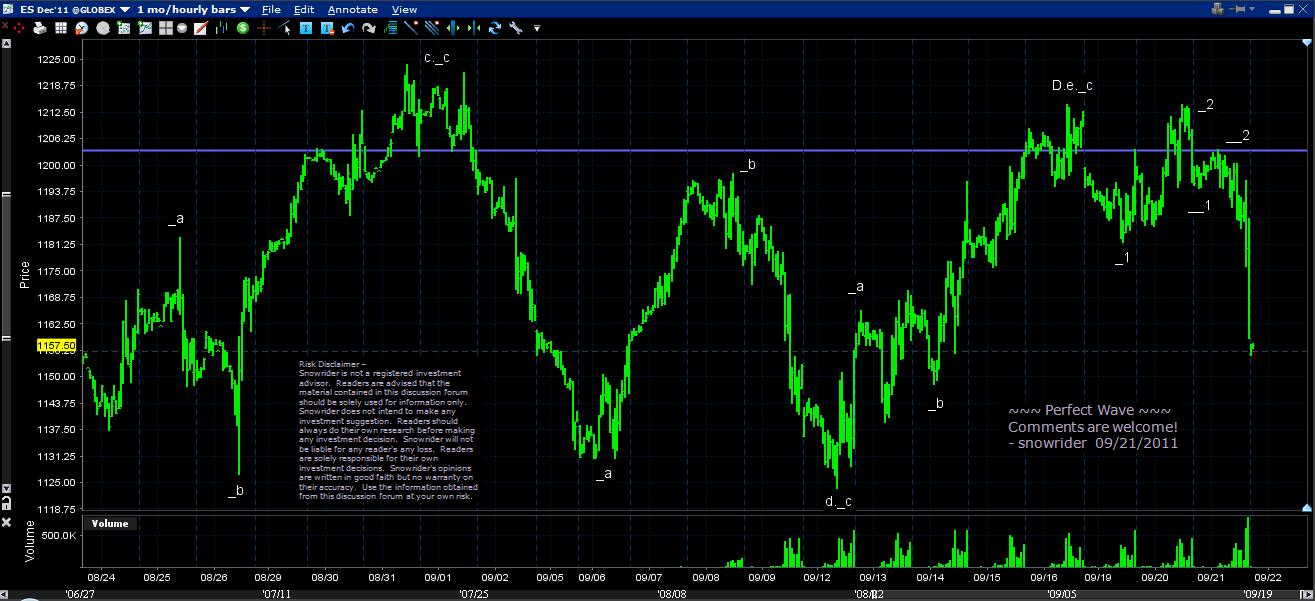
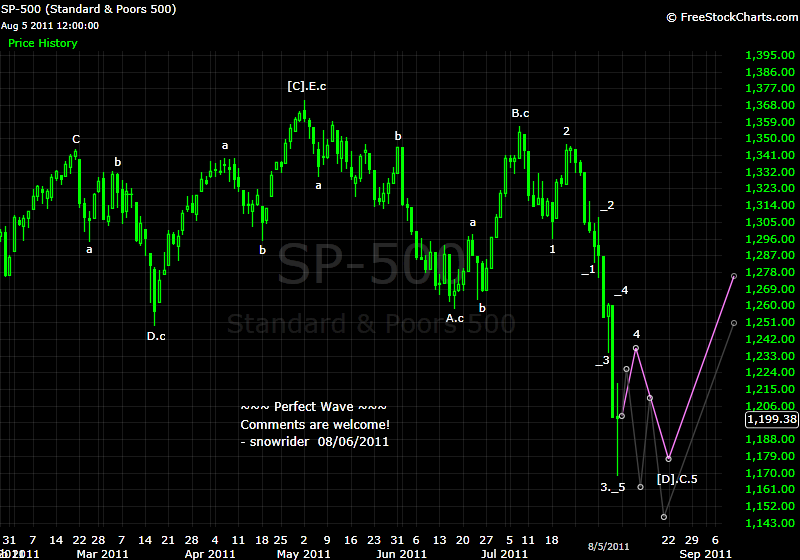
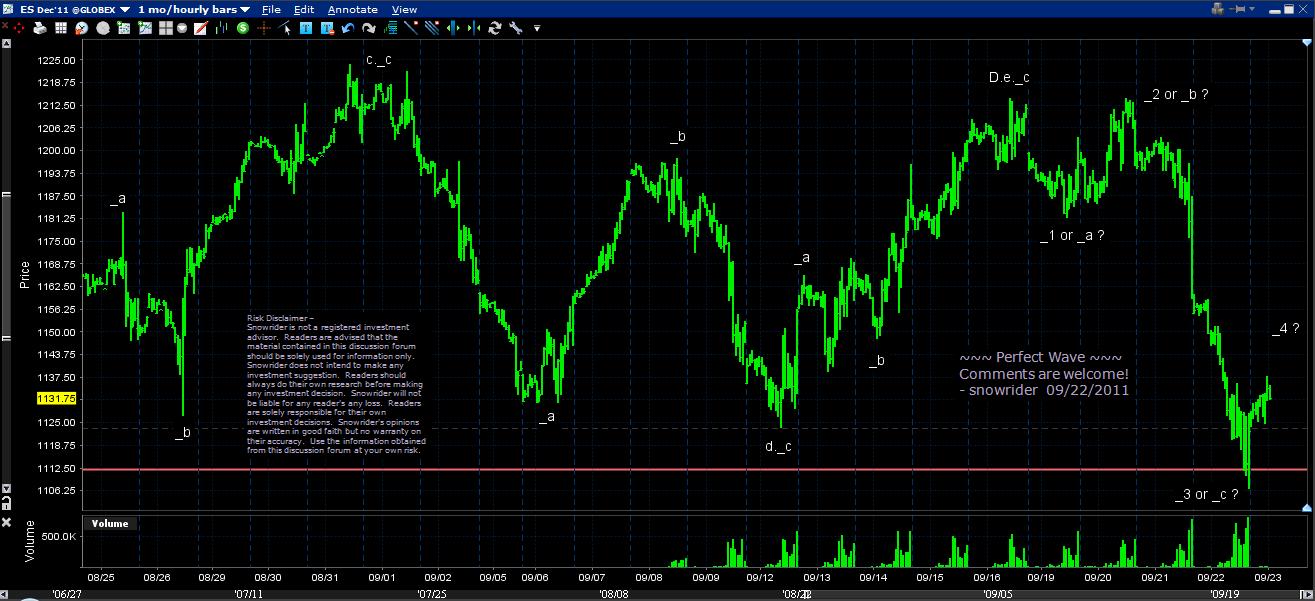
A very destructiv wave-__3 overnight ended wave-D consolidation. The penetration of wave-D-d's star ...
snowrider 发表于 2011-9-22 17:36

| 欢迎光临 华人论坛 (http://www.huarenv5.com/forum/) | Powered by Discuz! 7.2 |
