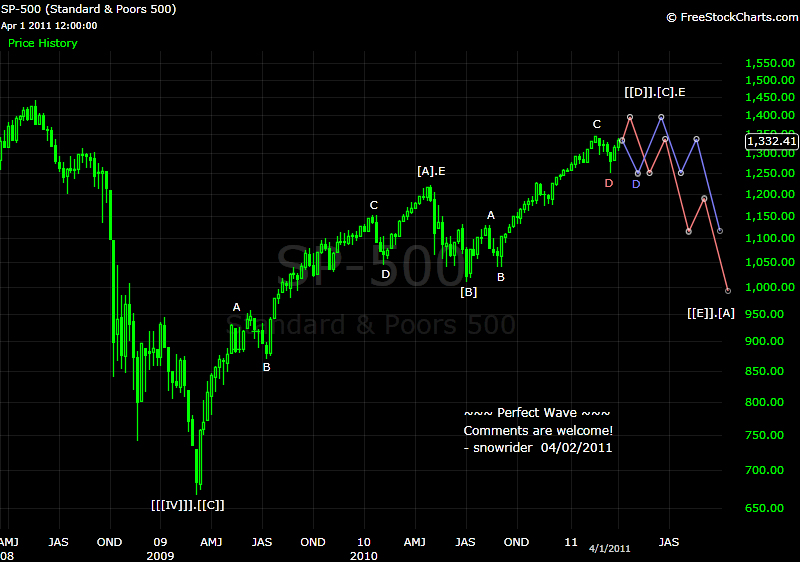
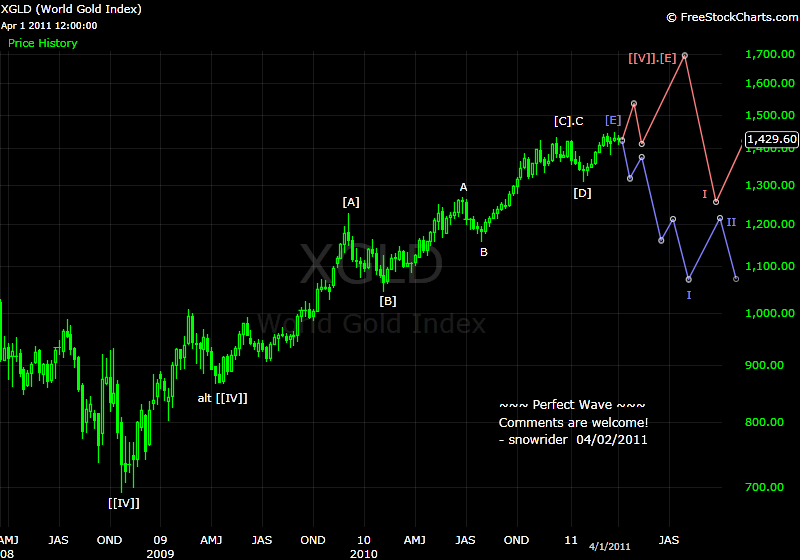
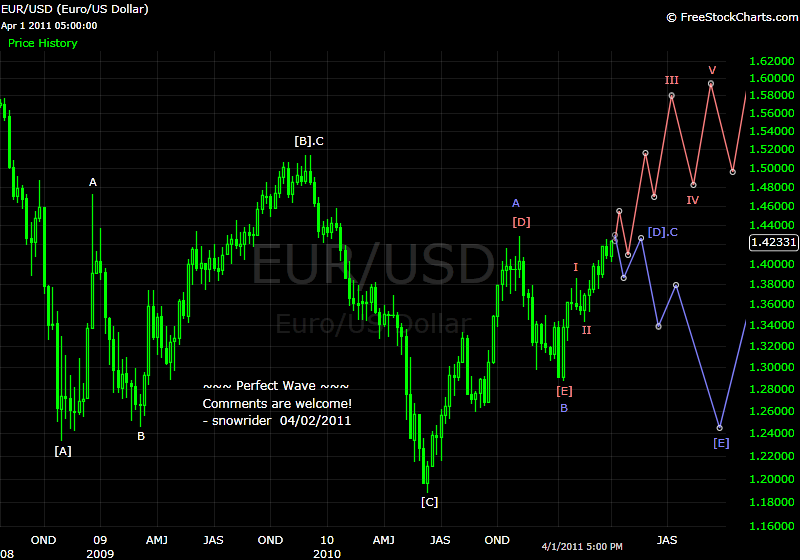
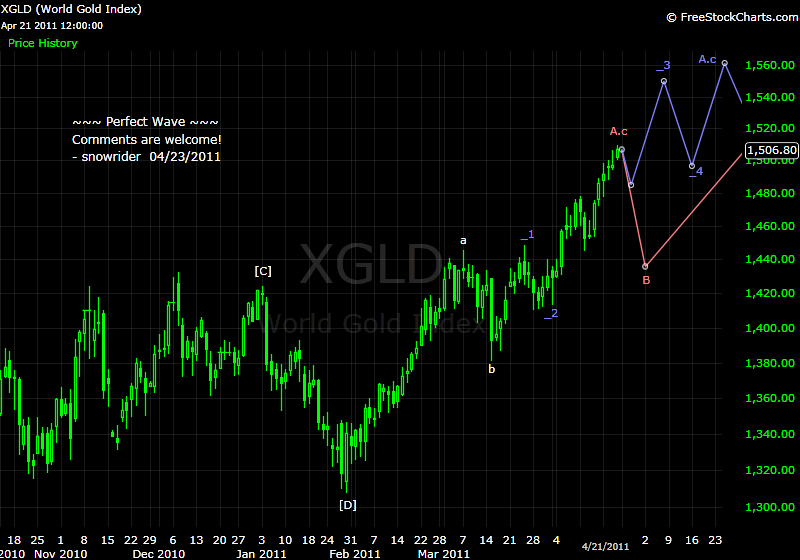
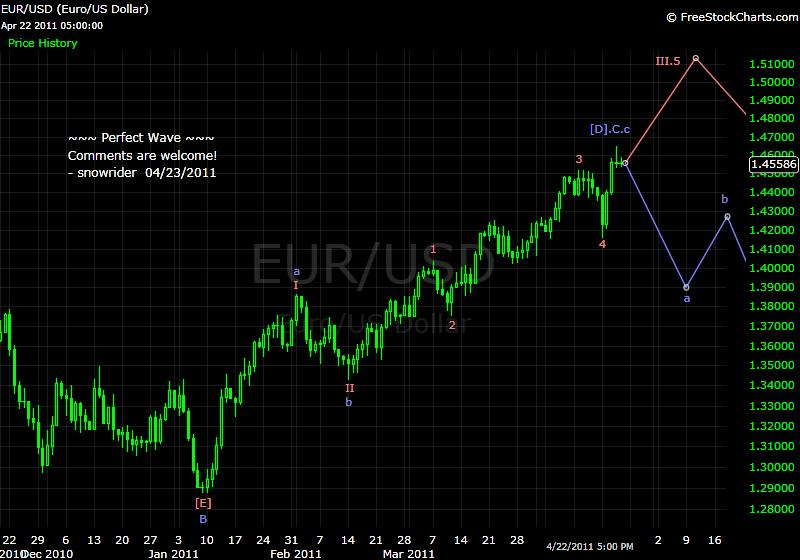
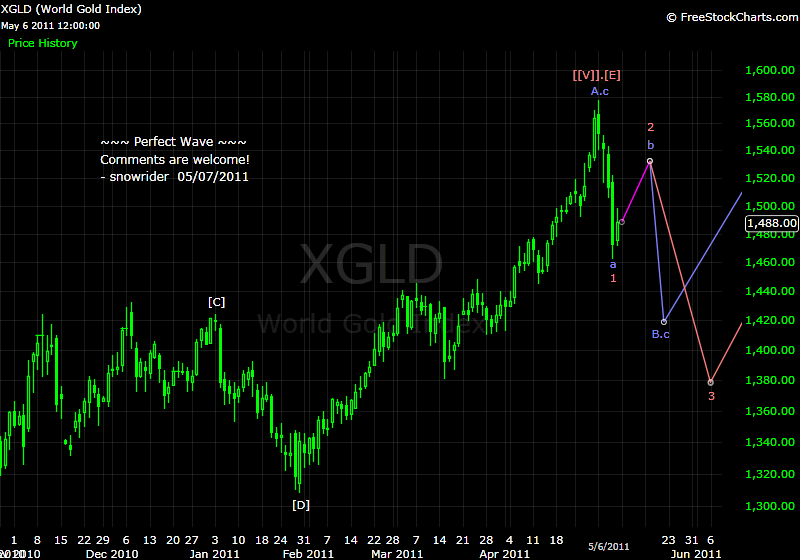
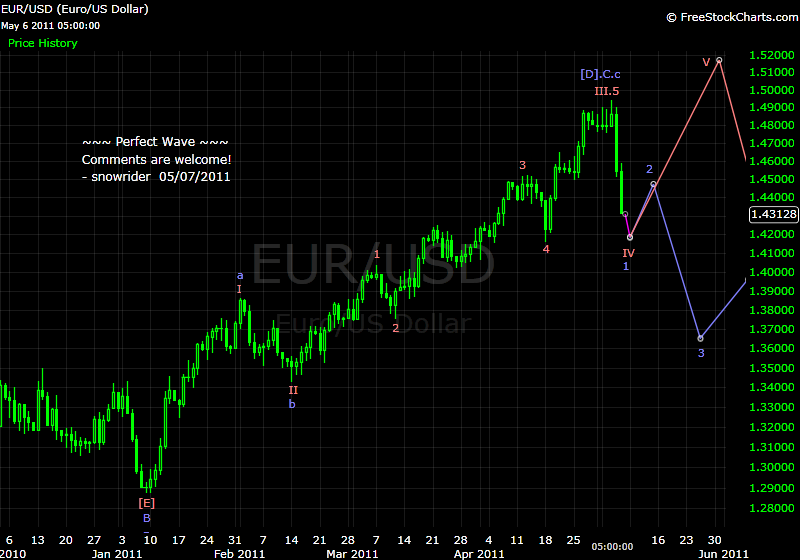
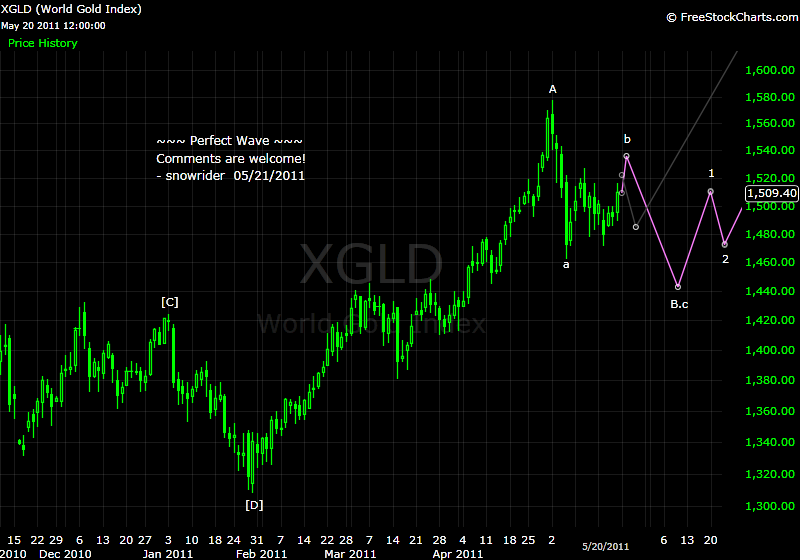
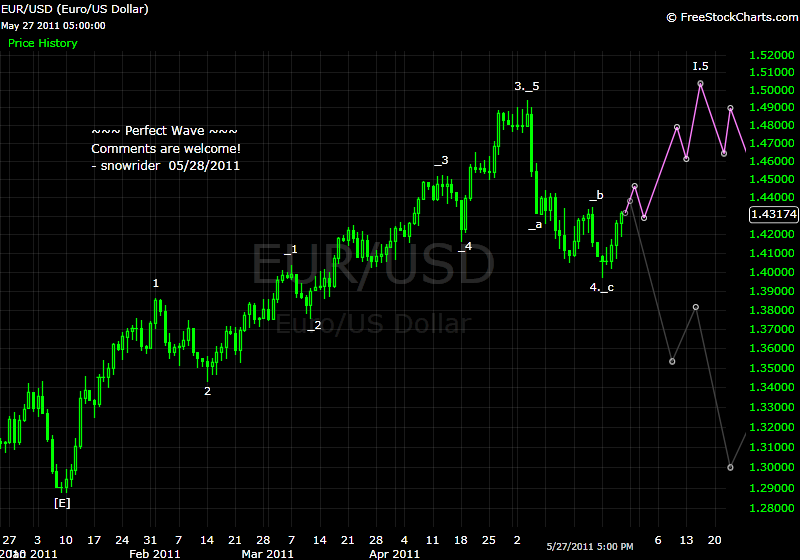
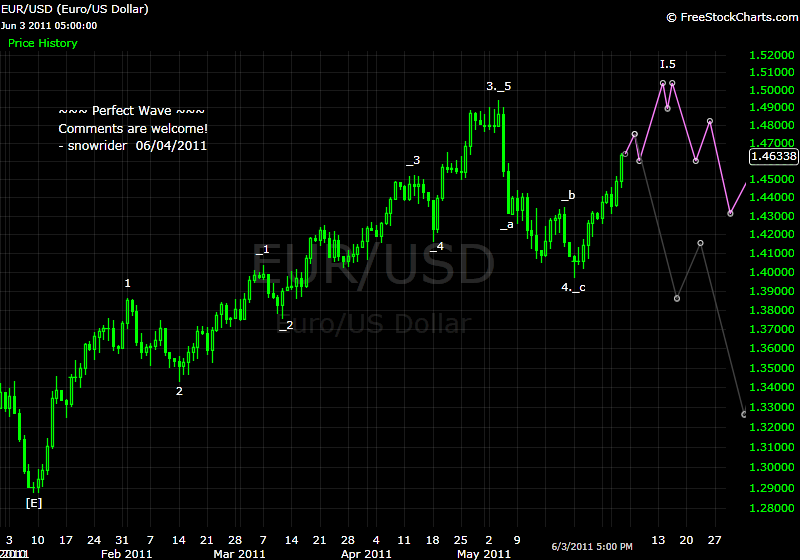
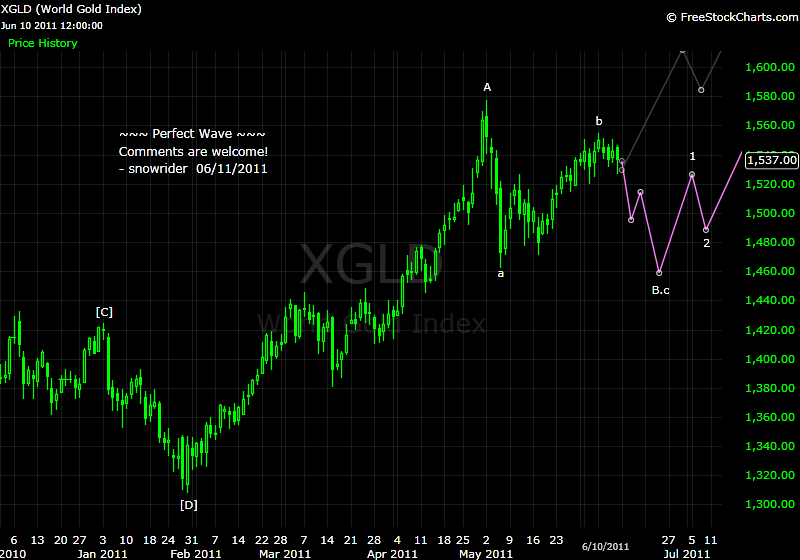
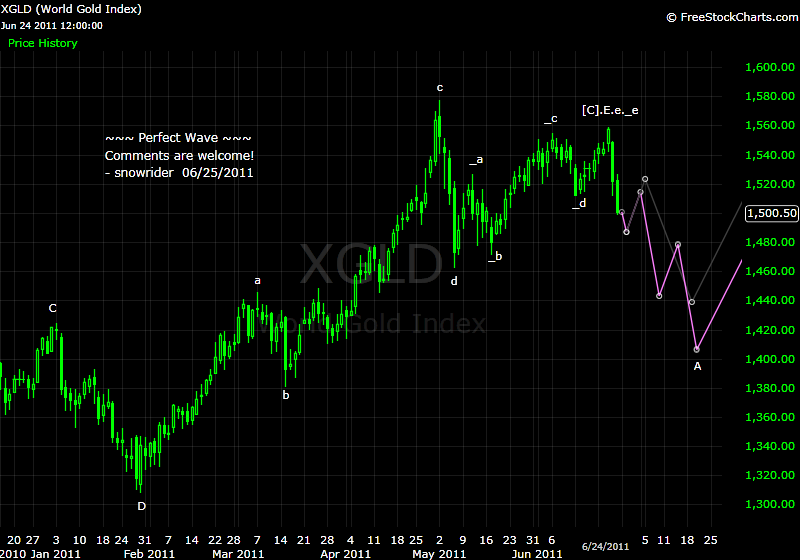
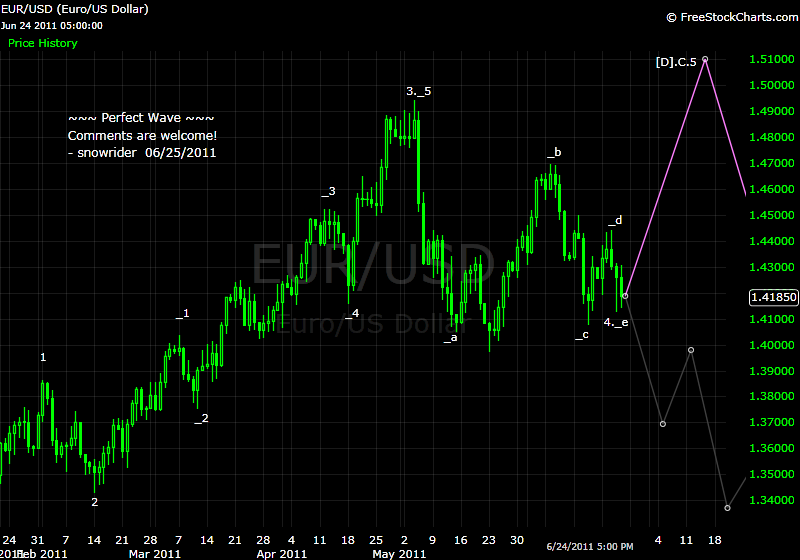
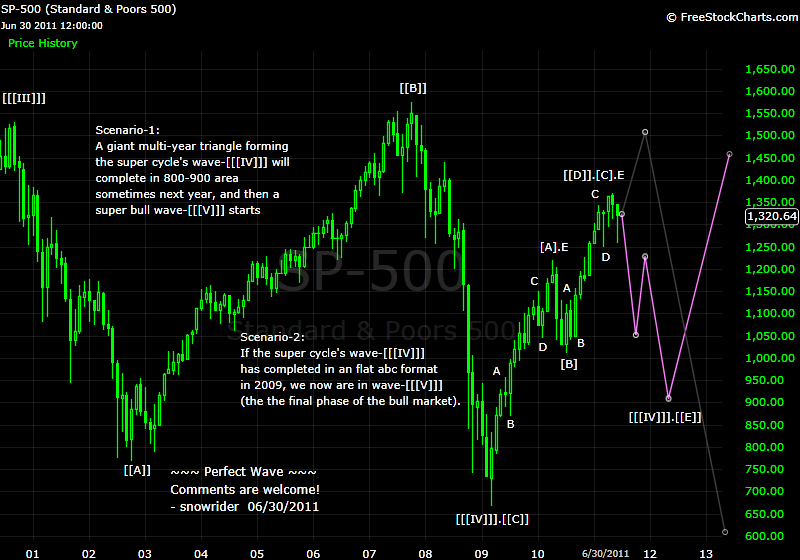
黄金美元都有牛熊两种数法,为什么sp全是熊?为什么0903以来的一定是abc反弹浪,而不是创新高的主升浪?
pdz 发表于 2011-4-2 23:02
黄金美元都有牛熊两种数法,为什么sp全是熊?为什么0903以来的一定是abc反弹浪,而不是创新高的主升浪?
pdz 发表于 2011-4-2 23:02
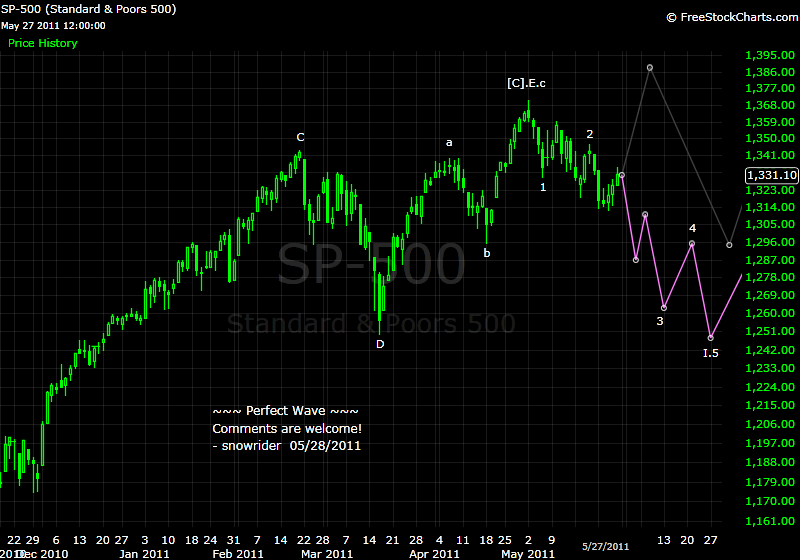
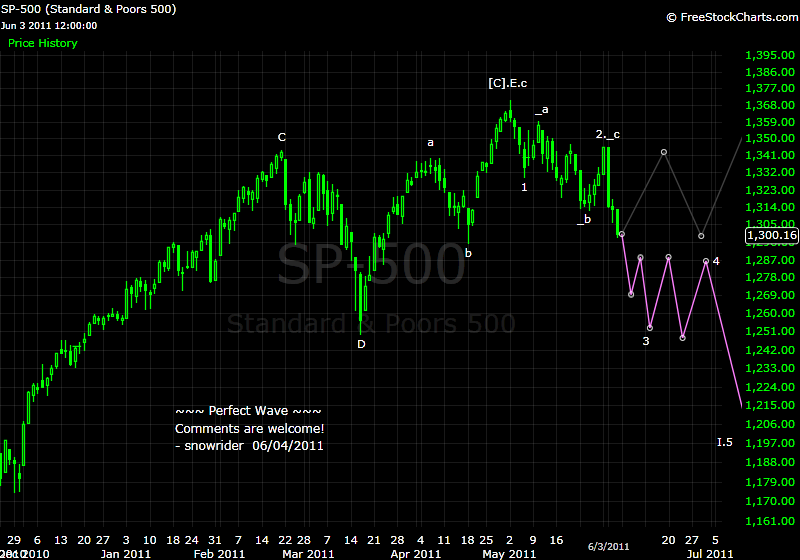
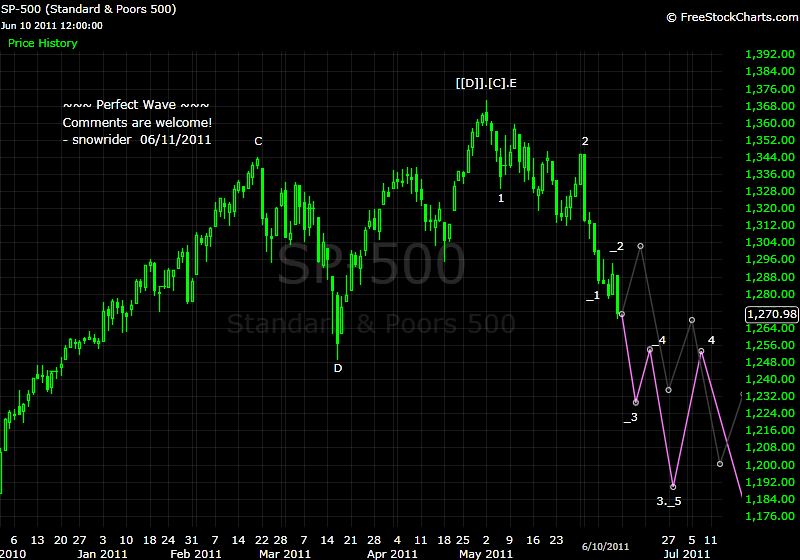
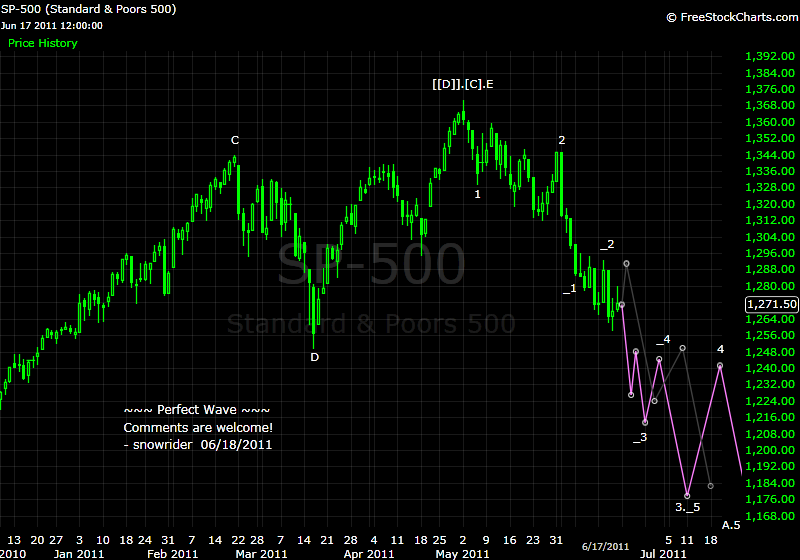
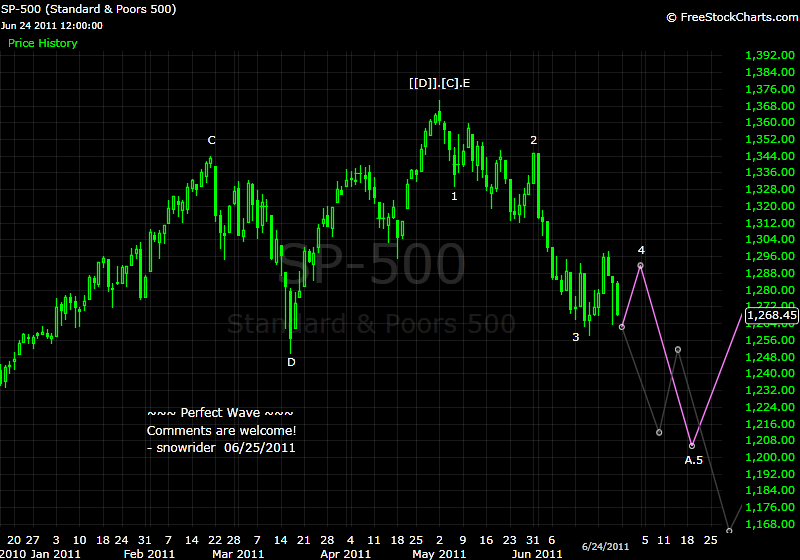
so SP heads south?
But not this week?
aimei 发表于 2011-4-3 18:43
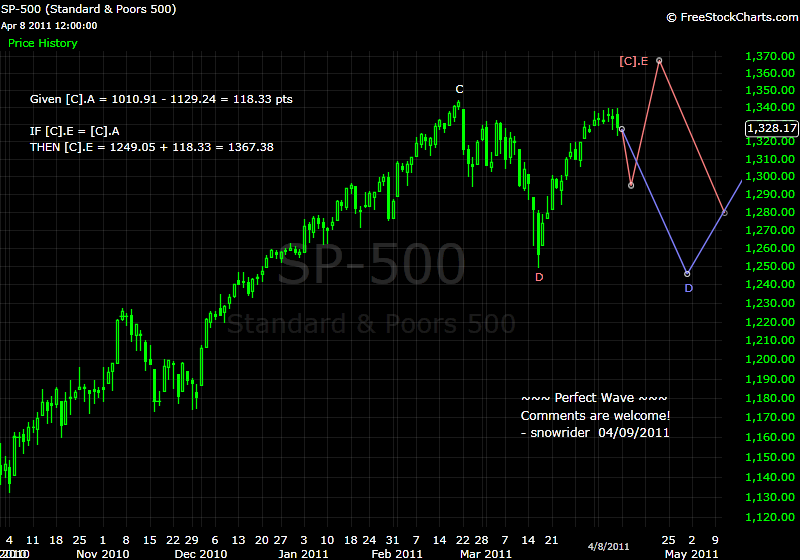
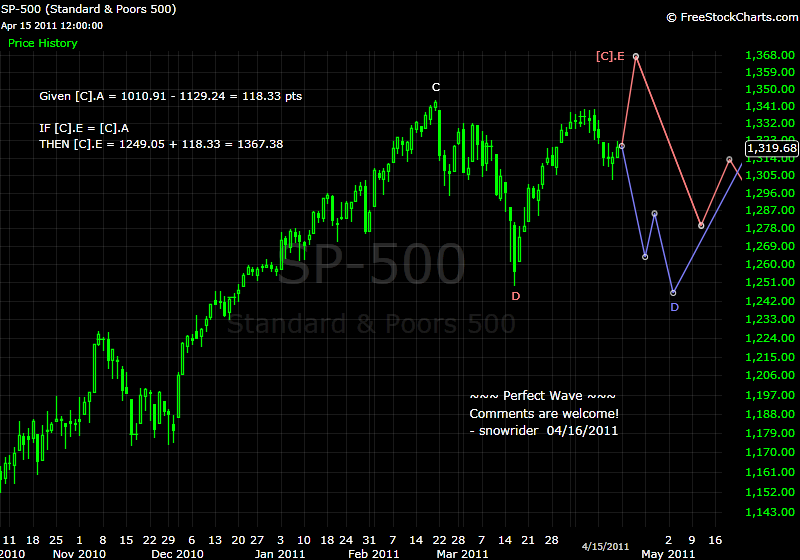
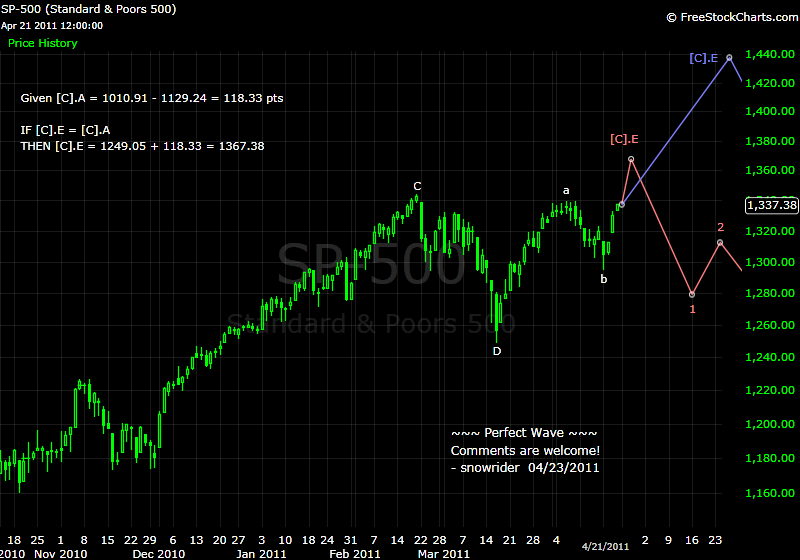
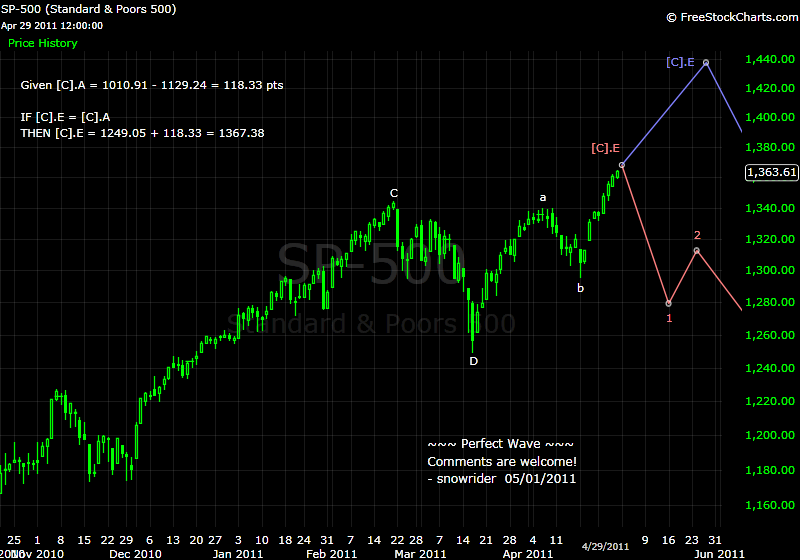
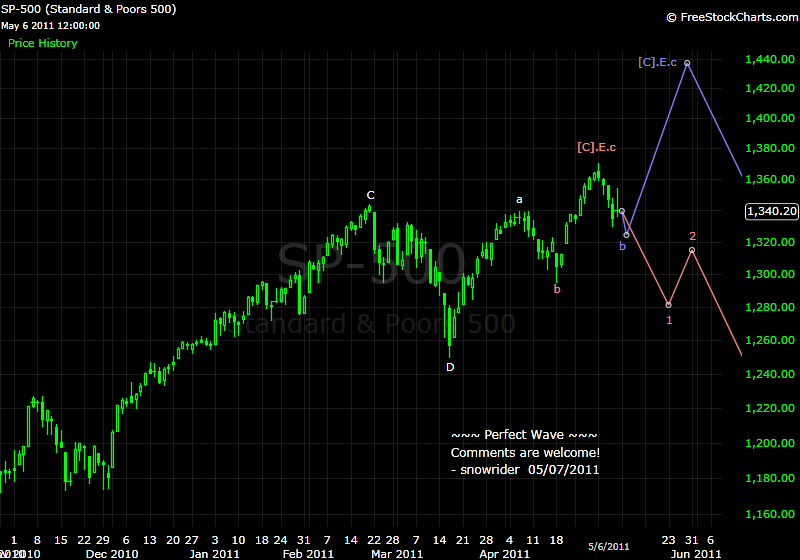
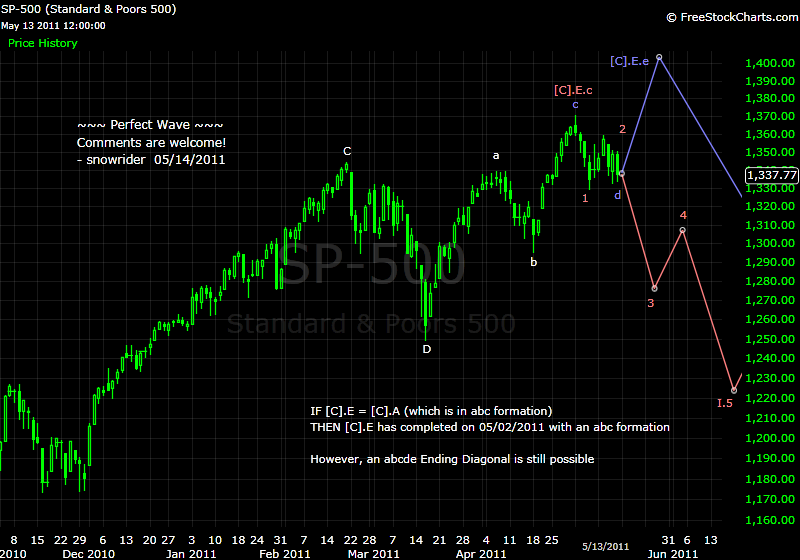
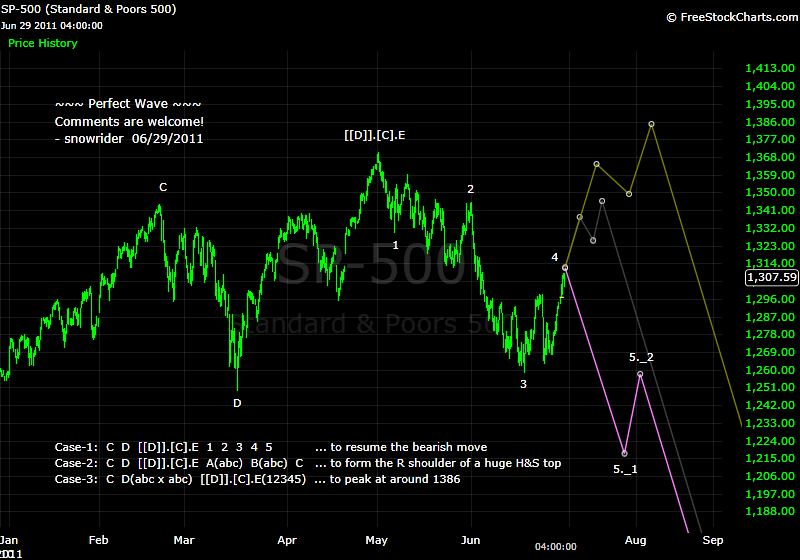
for SP500, which senario has higher probability? thanks
axp 发表于 2011-5-15 10:19
for SP500, which senario has higher probability? thanks
axp 发表于 2011-5-15 10:19
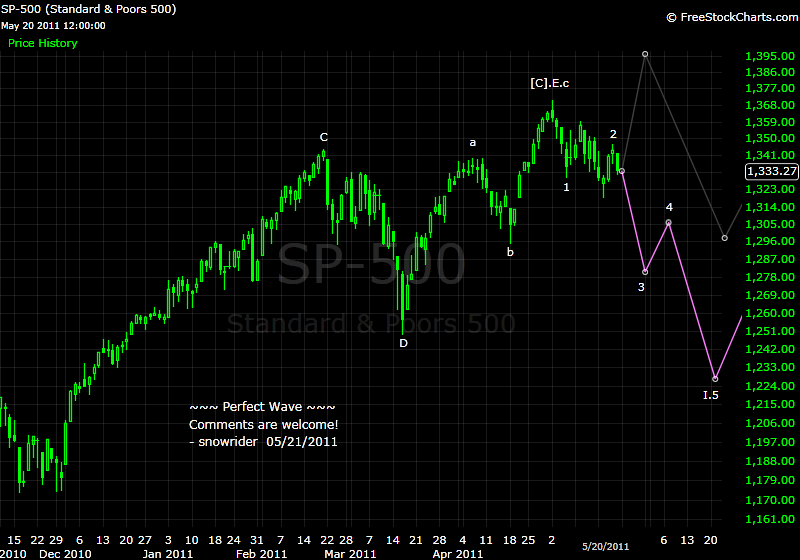
thanks for sharing. but why wave 2 is lower than wave 1
axp 发表于 2011-5-21 16:22
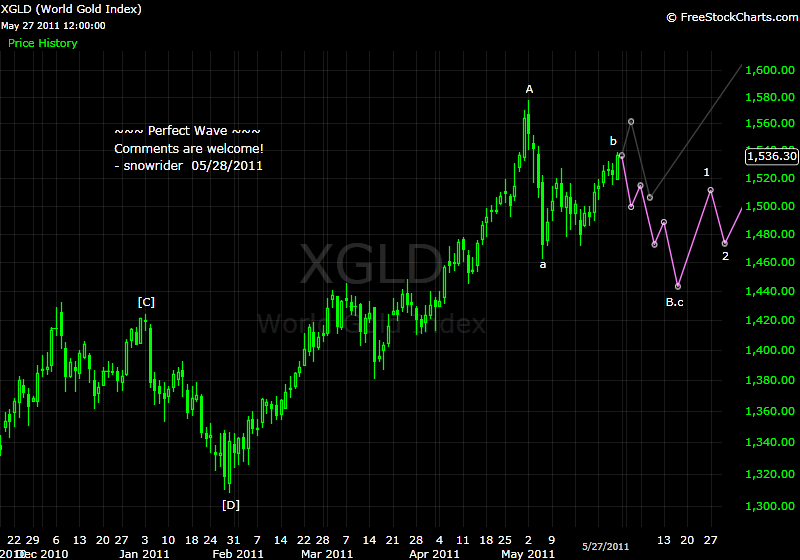
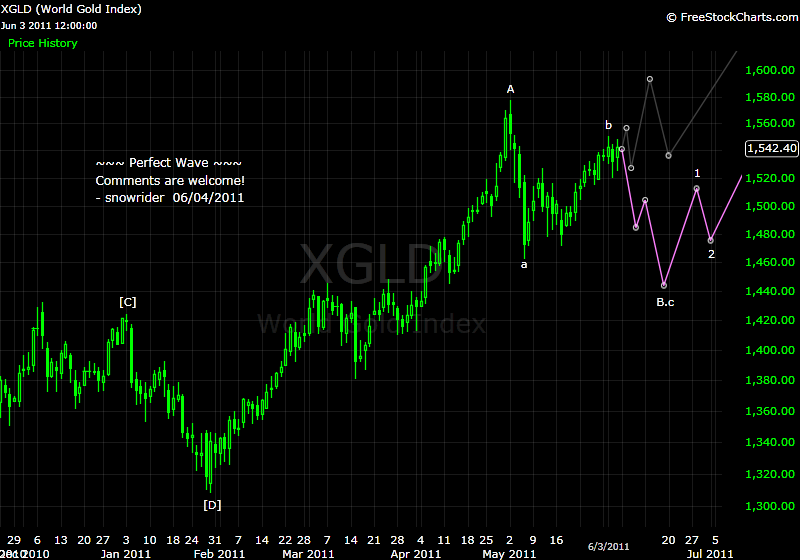
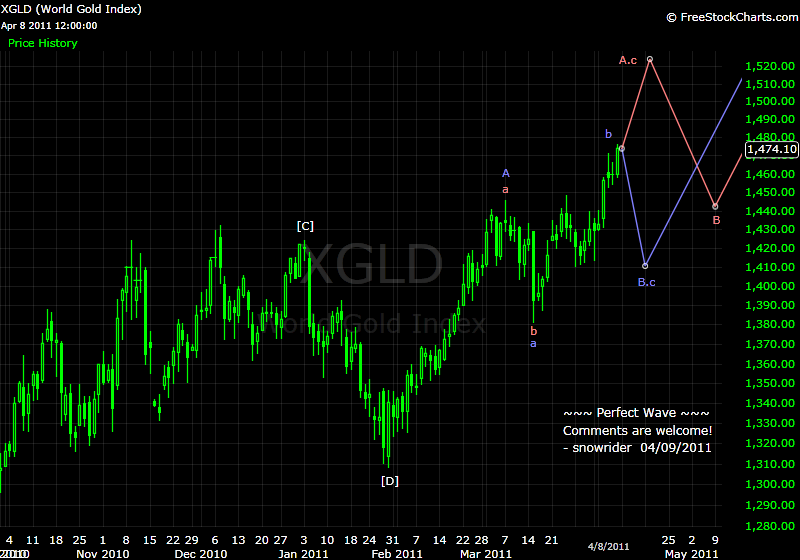
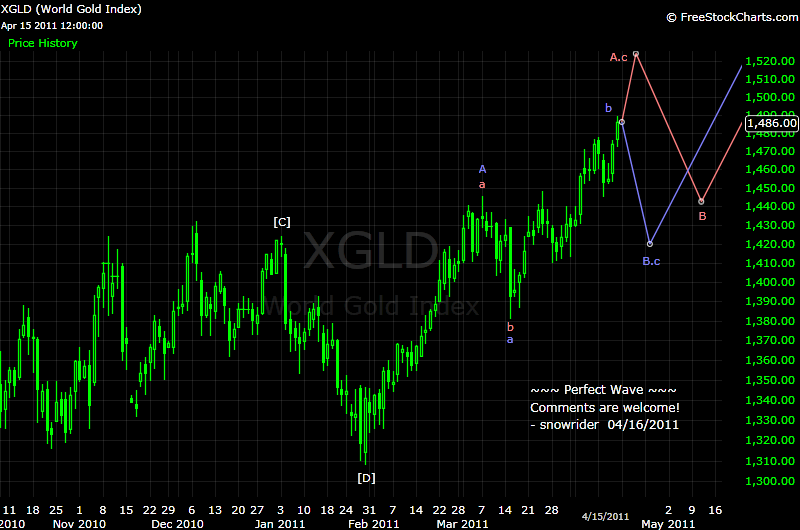
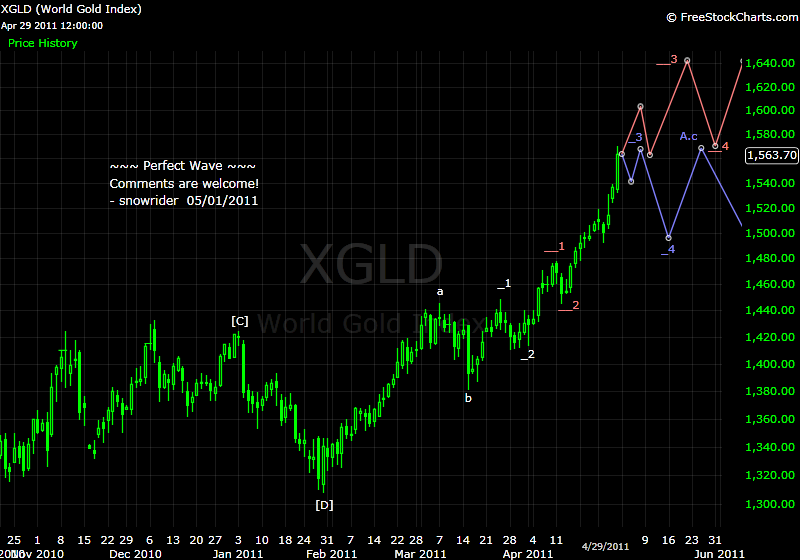
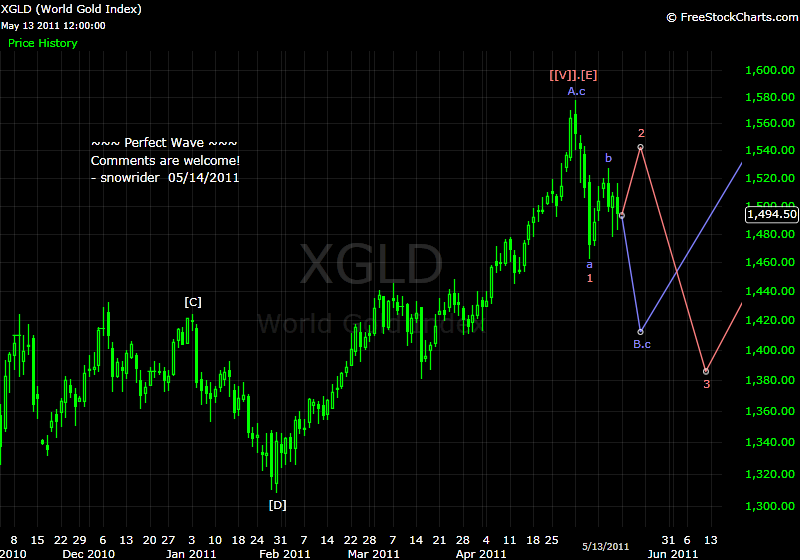
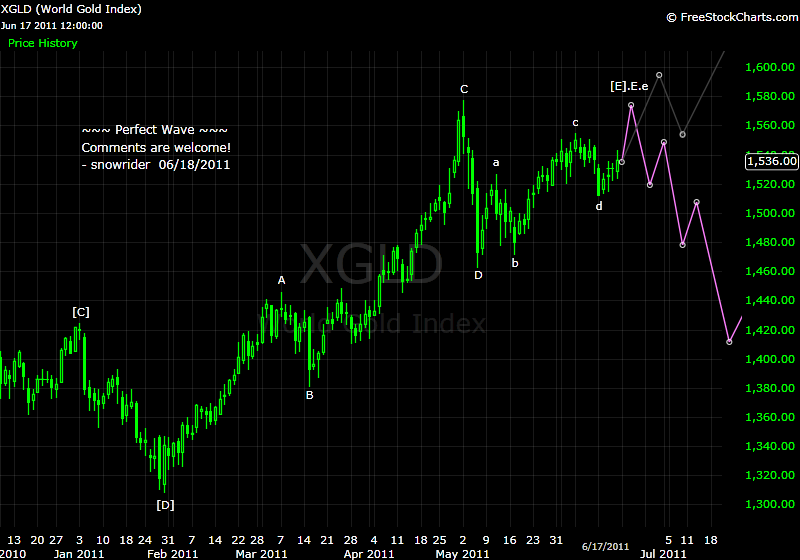
Thank for gold count.
Do you have Silver too ???
This is my silver count, can you please comment your idea? I'm bullish. I believe silver will reach $40 before open new lower.
...
snowrider, my english is not good, sorry.
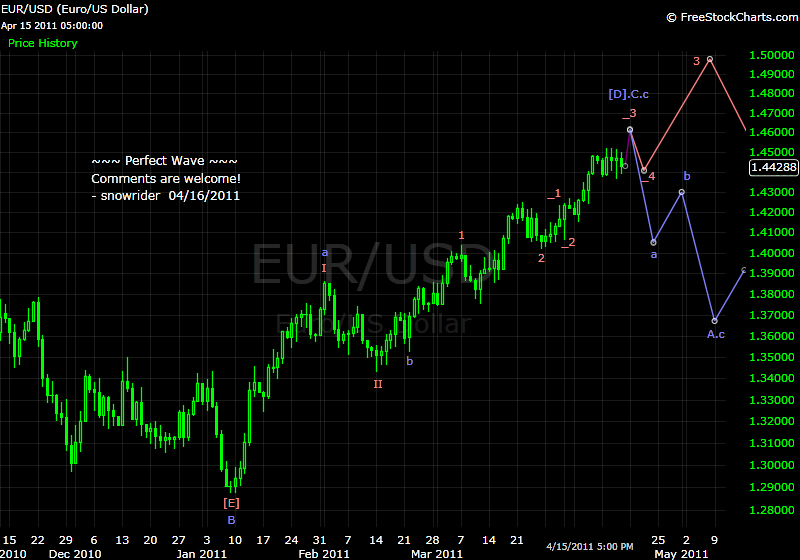
In your chart above, you mean we have a FLAT 3-3-5? And that FLAT is wave B of higher ZIGZAG?
...

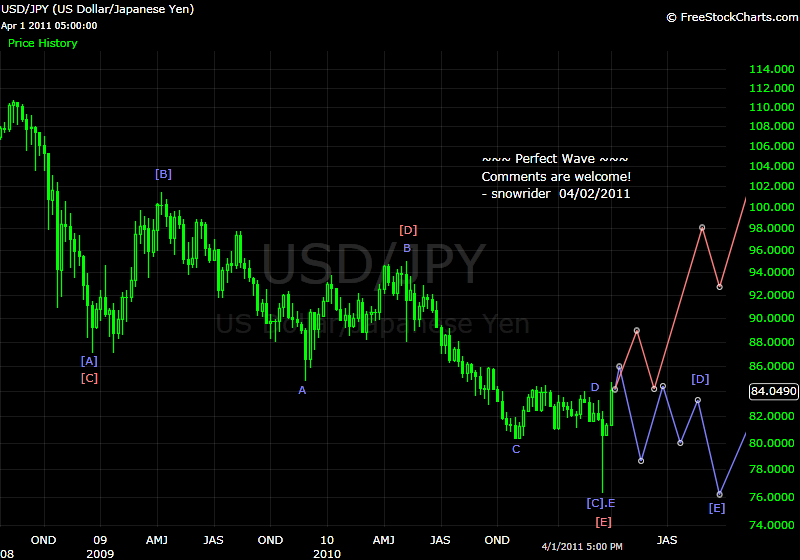
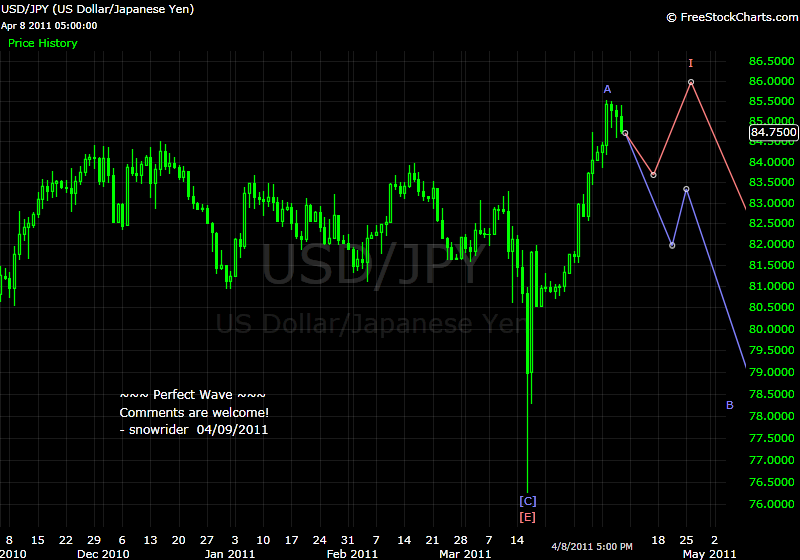
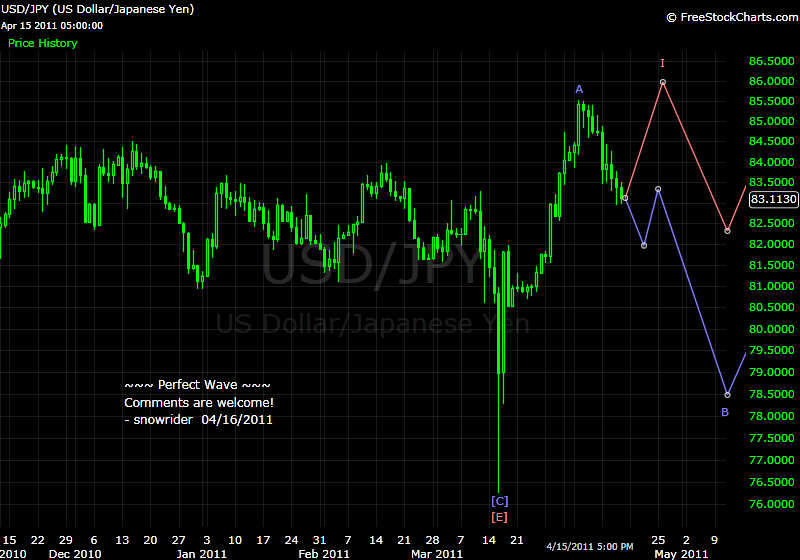
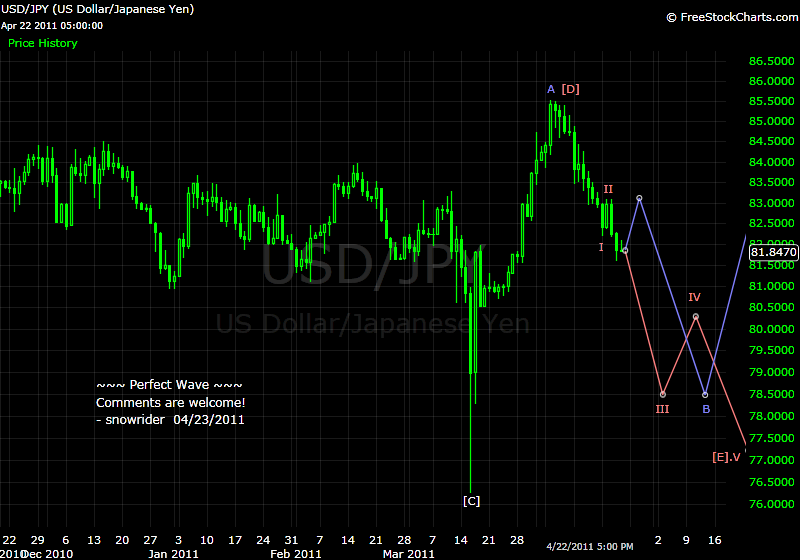
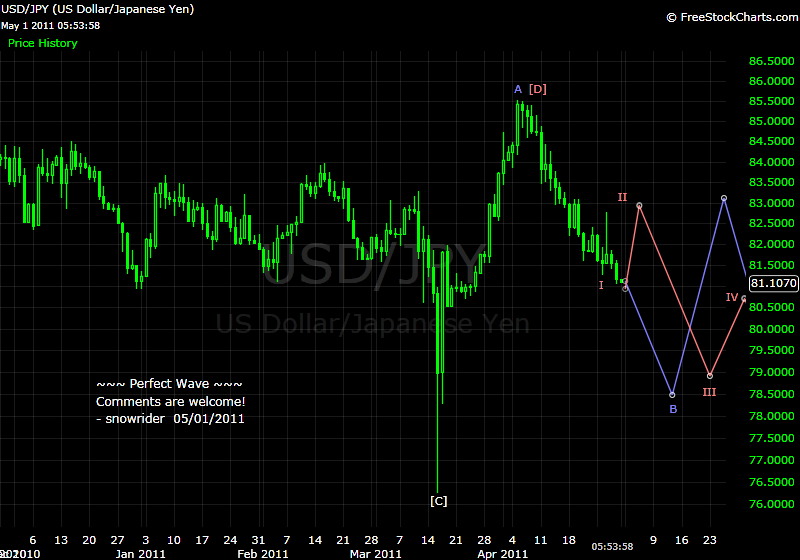
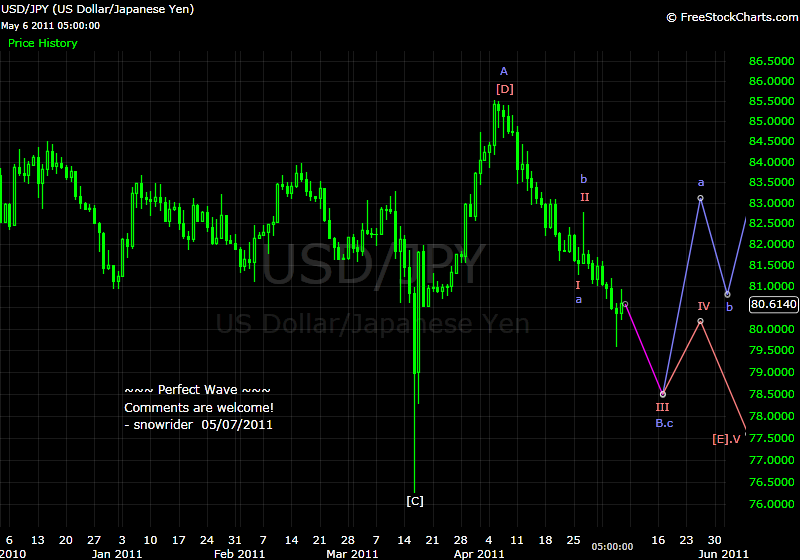
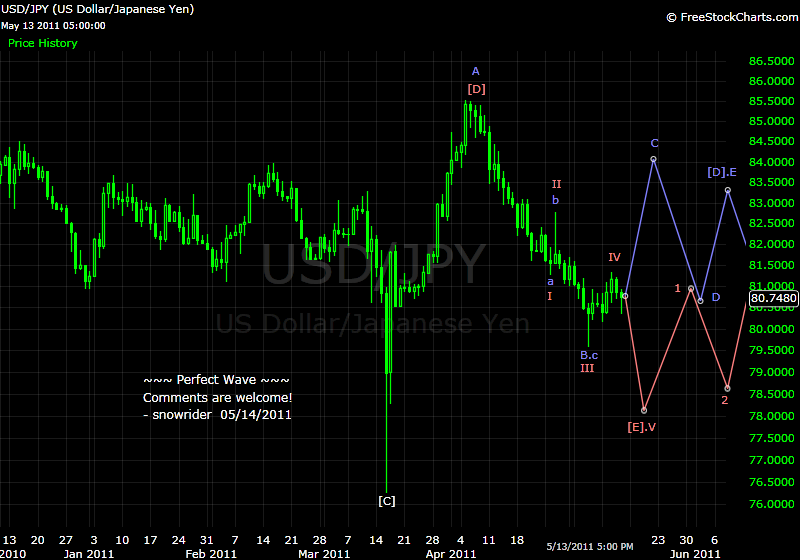
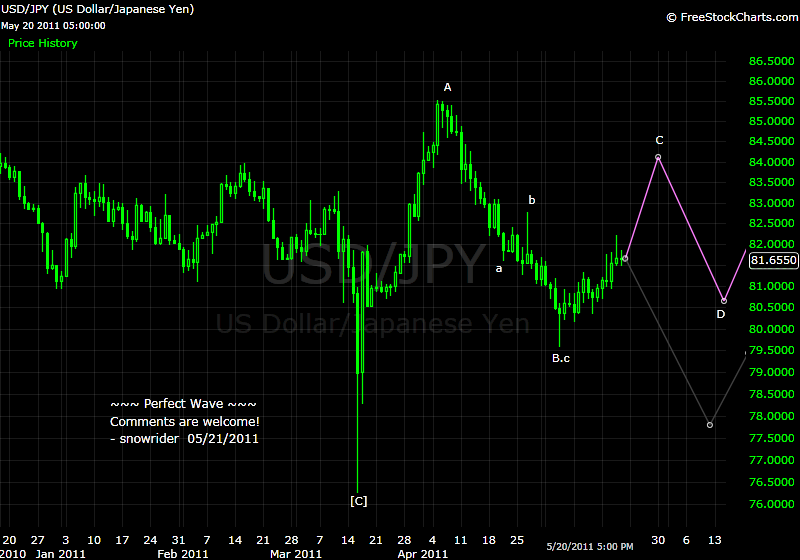
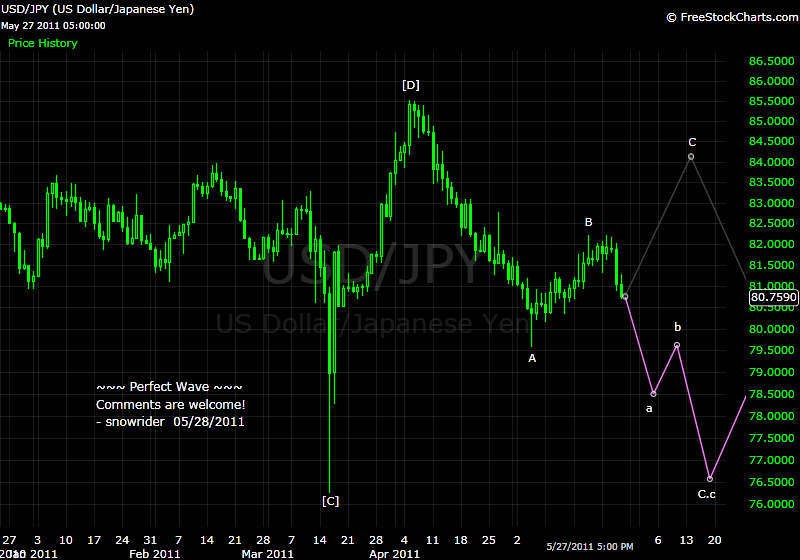
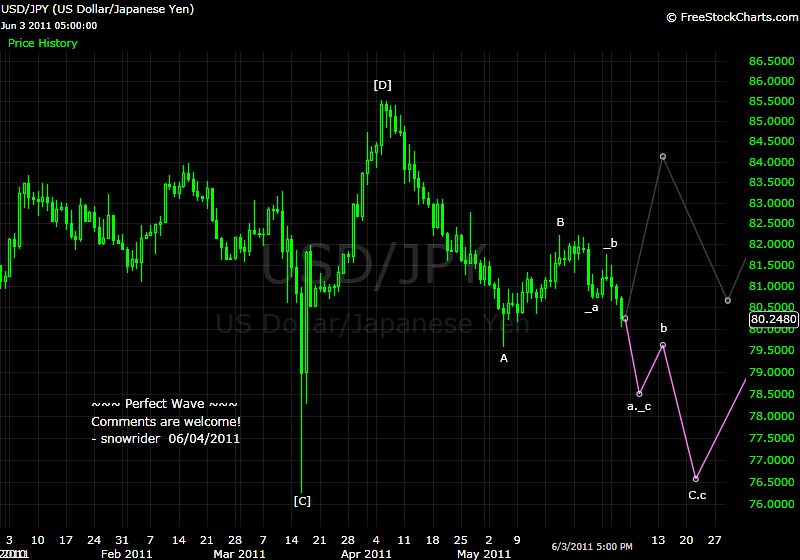
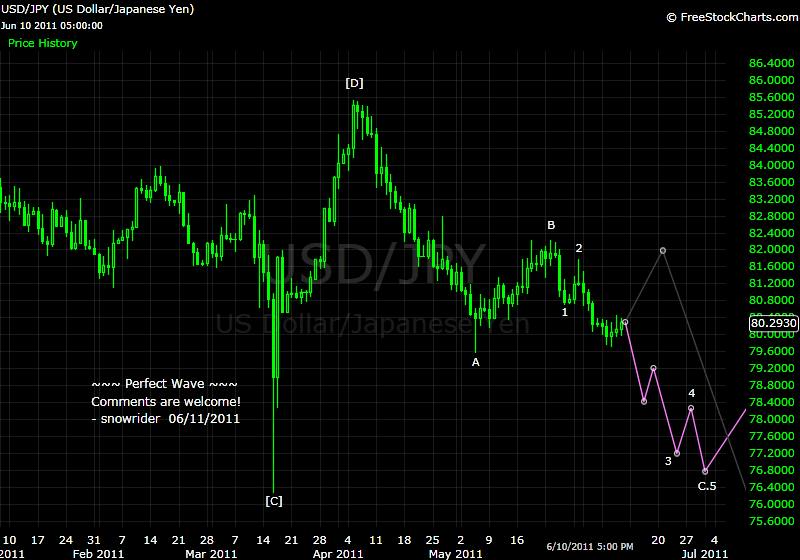
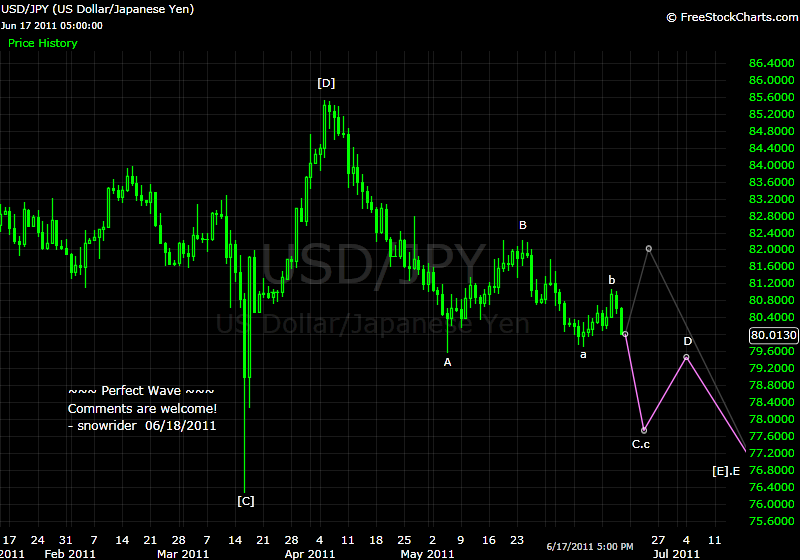
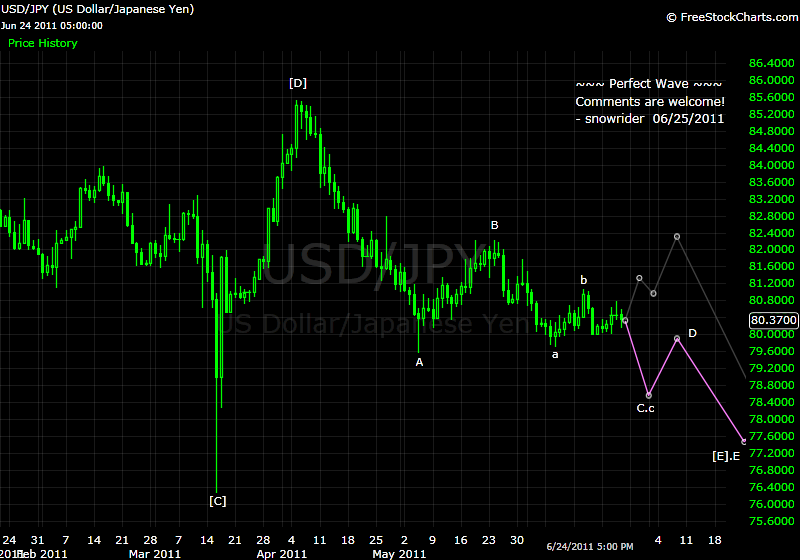
snowrider, can you please share your U/J weekly or monthly count? I'm interest in this chart, but do not know when to begin. My chart begin at 1 Apr 1989 and it's hard to count this chart ( impluse or corrective wave???)

 图片附件: 20110622 SP - Intraday.png (2011-6-22 22:37, 97.27 KB) / 下载次数 44


雪骑熊心不减啊,嘻嘻
谢谢!
棋王 发表于 2011-6-30 00:06
来研究一下, 能不能说说你给了几个SENARIO的意义? 对实际操作上说
not4weak 发表于 2011-7-1 14:34
回复 snowrider
这不是杠,凡是好东东, 都要经得起推敲.
你和我讨论了半天,我们都不清楚讨论啥.
not4weak 发表于 2011-7-1 14:51
| 欢迎光临 华人论坛 (http://www.huarenv5.com/forum/) | Powered by Discuz! 7.2 |
